Cloudera Manager Trigger Use Cases
Cloudera Manager allows you to monitor cluster performance. Some indicators require timely attention to keep your data safe. Triggers let you track occurrence and severity of issues so that you can fix problems before they result in system failures.
The conditions you create for your trigger can be quite complex, but they do not need to be in order to be useful. This topic describes two triggers that alert you when you are approaching capacity limits for your cluster.
Creating a Trigger for Memory Capacity
A common use case is to monitor memory usage, and trigger a warning if your system is approaching its upper limit.- In Cloudera Manager, go to the Hosts page.
- Click a link in the Name column to open a host status page.
- In the Health Tests section, click Create Trigger.
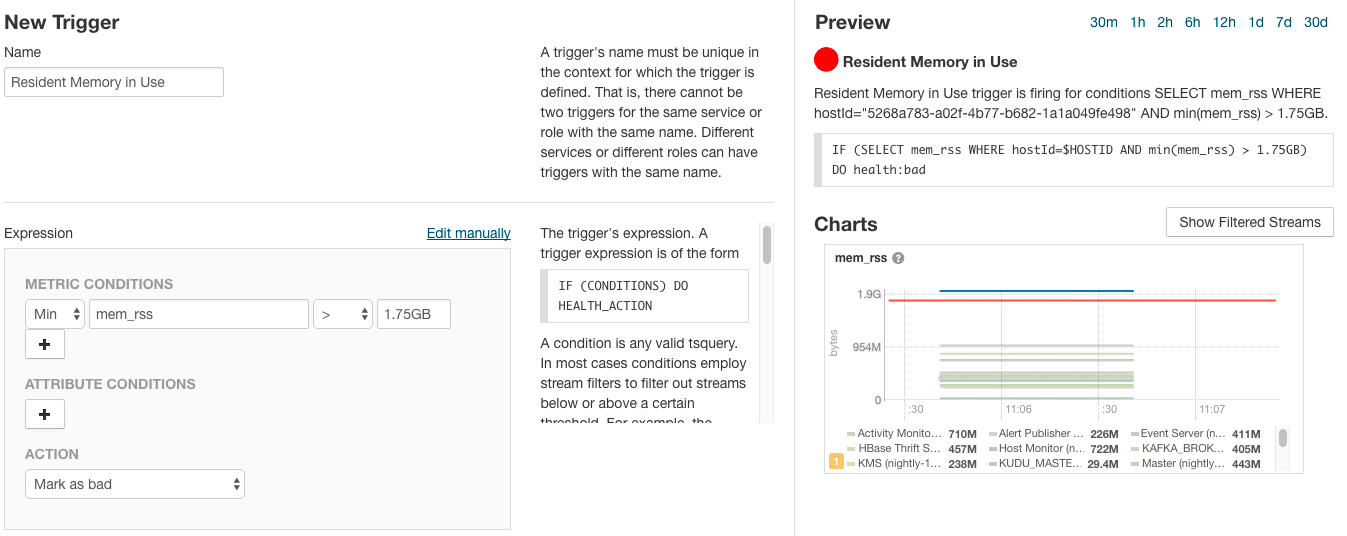
- On the New Trigger page, enter the name Resident Memory In Use.
- In Expression, set these metric conditions.
- Scalar Function: Min.
- Metric: mem_rss.
- Comparator: > (greater than).
- Scalar Value: 1.75GB. (This is a low value for demonstration purposes, so that it will trigger the action. In practice, use a value that more accurately reflects the memory limits of your cluster.)
- Set Action to Mark as bad.
As you work, the Preview shows the resulting chart and current status of your host.
- Scroll down and choose whether to apply this trigger to All hosts.
- Click Create Trigger.
Creating a Trigger for CPU Capacity
Another key indicator for performance is CPU capacity. Ideally, you will consistently use most of your allocated CPU resources on a regular basis without exceeding capacity.
- In Cloudera Manager, go to the Hosts page.
- Click a link in the Name column to open a host status page.
- In the Health Tests section, click Create Trigger.
- On the New Trigger page, enter the name CPU Capacity.
- In Expression, set these metric conditions.
- Scalar Function: Min.
- Metric: cpu_percent.
- Comparator: > (greater than).
- Scalar Value: 90.
- Set Action to Mark as concerning.
- Click Create Trigger.
This trigger fires whenever the CPU percentage exceeds 90%. However, just exceeding 90% of available CPU resources is not necessarily a bad thing. What would be of more concern is if CPU resources were to consistently exceed 90% over an extended period. You can modify the trigger to evaluate the average CPU usage over time.
To modify the trigger to capture high CPU usage in a five minute window, do the following.
- In Cloudera Manager, go to the Hosts page.
- Click a link in the Name column to open the host status page.
- In the Health Tests section, click the Show n Good link.
- Click the link for CPU Capacity.
- Choose .
The metric expression function for average over time, moving_avg, is not available from the pop-up menu in the editor. You can edit the expression directly using tsquery language.
- Above the Expression editor, click Edit manually.
- Revise the expression as follows.
IF (select cpu_percent where entityName=$HOSTID and min(moving_avg(cpu_percent, 300) ) > 90)
      DO health:concerning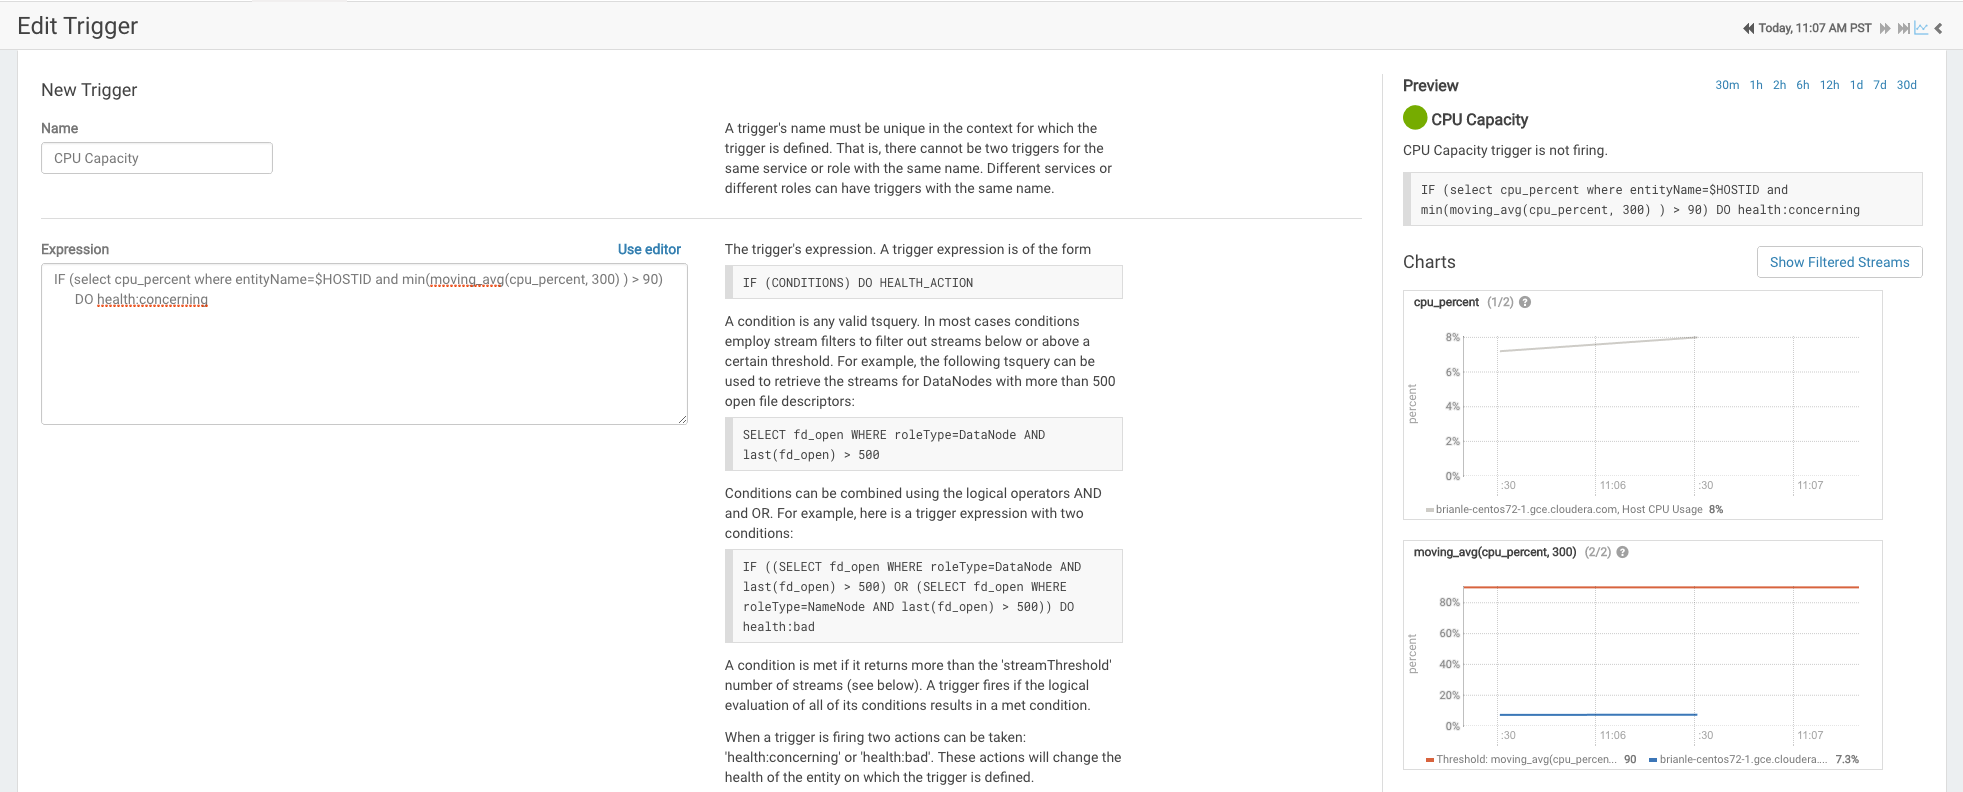
- Click Save Trigger.
For more information on defining triggers, see Triggers.
For more information on writing custom queries, see tsquery Language.
For the complete list of available metrics, see Cloudera Manager Metrics.
