Data Storage for Monitoring Data
The Service Monitor and Host Monitor roles in the Cloudera Management Service store time series data, health data, and Impala query and YARN application metadata.
On this page:
Configuring Service Monitor Data Storage
The Service Monitor stores time series data and health data, Impala query metadata, and YARN application metadata. By default, the data is stored in /var/lib/cloudera-service-monitor/ on the Service Monitor host. You can change this by modifying the Service Monitor Storage Directory configuration (firehose.storage.base.directory). To change this configuration on an active system, see Moving Monitoring Data on an Active Cluster.
- Time-series metrics and health data - Time-Series Storage (firehose_time_series_storage_bytes - 10 GB default, 10 GB minimum)
- Impala query metadata - Impala Storage (firehose_impala_storage_bytes - 1 GB default)
- YARN application metadata - YARN Storage (firehose_yarn_storage_bytes - 1 GB default)
For information about how metric data is stored in Cloudera Manager and how storage limits impact data retention, see Data Granularity and Time-Series Metric Data.
The default values are small, so you should examine disk usage after several days of activity to determine how much space is needed.
Configuring Host Monitor Data Storage
The Host Monitor stores time series data and health data. By default, the data is stored in /var/lib/cloudera-host-monitor/ on the Host Monitor host. You can change this by modifying the Host Monitor Storage Directory configuration. To change this configuration on an active system, follow the procedure in Moving Monitoring Data on an Active Cluster.
- Time-series metrics and health data: Time Series Storage (firehose_time_series_storage_bytes - 10 GB default, 10 GB minimum)
For information about how metric data is stored in Cloudera Manager and how storage limits impact data retention, see Data Granularity and Time-Series Metric Data.
The default value is small, so you should examine disk usage after several days of activity to determine how much space they need. The Charts Library tab on the Cloudera Management Service page shows the current disk space consumed and its rate of growth, categorized by the type of data stored. For example, you can compare the space consumed by raw metric data to daily summaries of that data.
Viewing Host and Service Monitor Data Storage
- Select .
- Click the Charts Library tab.
Data Granularity and Time-Series Metric Data
The Service Monitor and Host Monitor store time-series metric data in a variety of ways. When the data is received, it is written as-is to the metric store. Over time, the raw data is summarized to and stored at various data granularities. For example, after ten minutes, a summary point is written containing the average of the metric over the period as well as the minimum, the maximum, the standard deviation, and a variety of other statistics. This process is summarized to produce hourly, six-hourly, daily, and weekly summaries. This data summarization procedure applies only to metric data. When the Impala query and YARN application monitoring storage limit is reached, the oldest stored records are deleted.
The Service Monitor and Host Monitor internally manage the amount of overall storage space dedicated to each data granularity level. When the limit for a level is reached, the oldest data points at that level are deleted. Metric data for that time period remains available at the lower granularity levels. For example, when an hourly point for a particular time is deleted to free up space, a daily point still exists covering that hour. Because each of these data granularities consumes significantly less storage than the previous summary level, lower granularity levels can be retained for longer periods of time. With the recommended amount of storage, weekly points can often be retained indefinitely.
Some features, such as detailed display of health results, depend on the presence of raw data. Health history is maintained by the event store dictated by its retention policies.
Moving Monitoring Data on an Active Cluster
You can change where monitoring data is stored on a cluster.
Basic: Changing the Configured Directory
- Stop the Service Monitor or Host Monitor.
- Save your old monitoring data and then copy the current directory to the new directory (optional).
- Update the Storage Directory configuration option (firehose.storage.base.directory) on the corresponding role configuration page.
- Start the Service Monitor or Host Monitor.
Advanced: High Performance
For the best performance, and especially for a large cluster, Host Monitor and Service Monitor storage directories should have their own dedicated spindles. In most cases, that provides sufficient performance, but you can divide your data further if needed. You cannot configure this directly with Cloudera Manager; instead, you must use symbolic links.
For example, if all your Service Monitor data is located in /data/1/service_monitor, and you want to separate your Impala data from your time series data, you could do the following:
- Stop the Service Monitor.
- Move the original Impala data in /data/1/service_monitor/impala to the new directory, for example /data/2/impala_data.
- Create a symbolic link from /data/1/service_monitor/impala to /data/2/impala_data with the following command:
ln -s /data/2/impala_data /data/1/service_monitor/impala
- Start the Service Monitor.
Host Monitor and Service Monitor Memory Configuration
You can configure Java heap size and non-Java memory size. The memory recommended for these configuration options depends on the number of hosts in the cluster, the services running on the cluster, and the number of monitored entities. Monitored entities are the objects monitored by the Service Monitor or Host Monitor. As the number of hosts and services increases, the number of monitored entities also increases.
In addition to the memory configured, the Host Monitor and Service Monitor use the Linux page cache. Memory available for page caching on the Host Monitor and Service Monitor hosts improves performance.
To configure memory allocations, determine how many entities are being monitored and then consult the tables below for required and recommended memory configurations.
- Go to .
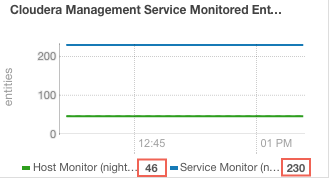
- Locate the chart with the title Cloudera Management Service Monitored Entities.
The number of monitored entities for the Host Monitor and Service Monitor displays at the bottom of the chart. In the following example, the Host Monitor has 46 monitored entities and the Service Monitor has 230 monitored entities.
- Use the number of monitored entities for the Host Monitor to determine its memory requirements and recommendations in the tables below.
- Use the number of monitored entities for the Service Monitor to determine its memory requirements and recommendations in the tables below.
Clusters with HDFS, YARN, or Impala
Use the recommendations in this table for clusters where the only services having worker roles are HDFS, YARN, or Impala.
| Number of Monitored Entities | Number of Hosts | Required Java Heap Size | Recommended Non-Java Heap Size |
|---|---|---|---|
| 0-2,000 | 0-100 | 1 GB | 6 GB |
| 2,000-4,000 | 100-200 | 1.5 GB | 6 GB |
| 4,000-8,000 | 200-400 | 1.5 GB | 12 GB |
| 8,000-16,000 | 400-800 | 2.5 GB | 12 GB |
| 16,000-20,000 | 800-1,000 | 3.5 GB | 12 GB |
Clusters with HBase, Solr, Kafka, or Kudu
Use the recommendations when services such as HBase, Solr, Kafka, or Kudu are deployed in the cluster. These services typically have larger quantities of monitored entities.
| Number of Monitored Entities | Number of Hosts | Required Java Heap Size | Recommended Non-Java Heap Size |
|---|---|---|---|
| 0-30,000 | 0-100 | 2 GB | 12 GB |
| 30,000-60,000 | 100-200 | 3 GB | 12 GB |
| 60,000-120,000 | 200-400 | 3.5 GB | 12 GB |
| 120,000-240,000 | 400-800 | 8 GB | 20 GB |
Disabling Metric rollup
- Calculations of time-based rollups are stopped. (This is for values such as TEN_MINUTELY, HOURLY, SIX_HOURLY, DAILY, or WEEKLY.)
- Forces all time-series queries to use RAW data granularity, in order that time-series queries that would require rollup of data (for example, charts using 12h and above intervals) continue working using RAW data.
- Reallocates time-series storage to use RAW data only. The storage allocation of time-series tables is calculated as follows: the configured allocation * a fraction allocated to each table. Fraction values are: 35% for RAW data and 50% for aggregated data for a total of 85%. (the remaining 15% is used for subject store, which is not relevant in this case). Reallocation gives all 85% to RAW data so that longer periods can be stored from RAW data and storage is not wasted on unused rollups.
- Elastic partitioning is enabled.
- Log in to the Cloudera Manager Admin Console.
- Go to .
- Click the Configuration tab.
- Search for "Advanced Configuration Snippet (Safety Valve) for cmon.conf"
- Enter the following configuration:
- Name: firehose.timeseries.rollup.disabled
- Value: true
- You can also choose to configure elastic partitioning of time-series tables. When you disable metric rollup, elastic partitioning is enabled by default. Elasticity allows Cloudera
Manager to gradually expire unused rollup data rather than immediately deleting it. If you disable elastic partitioning, aggregated historical data will expire immediately. Cloudera recommends that
you enable elastic partitioning.
To disable elastic partitioning, click the + icon and add another configuration:
- Name: firehose.timeseries.partitionpolicy.elastic.enabled
- Value: false
