Cloudera Navigator Audit Event Reports
Required Role: Auditing Viewer (or Full Administrator)
- Audit Events listing, which displays all recent events in reverse chronological order
- Recent Denied Accesses, which displays all accesses within the cluster and highlights denied access attempts in red, for easy identification.
These two default reports are starting points. Use the Audit Report and define filters to create new reports can be created by defining and applying filters to fine-tune the selected results. Give the filtered report specifications for future use, and export (download) any report to CSV and JSON file formats.
In addition, the metadata about the audit reports you create and save is recorded by the Navigator Metadata Server.
This section shows you how to use the Cloudera Navigator console to create audit reports.
Creating Audit Event Reports
Selecting the Audit menu in the Cloudera Navigator console displays the Audit Events report. This report displays all audit events captured in the last 1 hour. You can modify the filters configured for this report and save it, giving it a new name, as follows.
- To save a filtered version of the Audit Events report:
- Optionally specify filters (seeFiltering Audit Events in the Console) .
- Click Save As Report.
- Create a new report by clicking New Report.
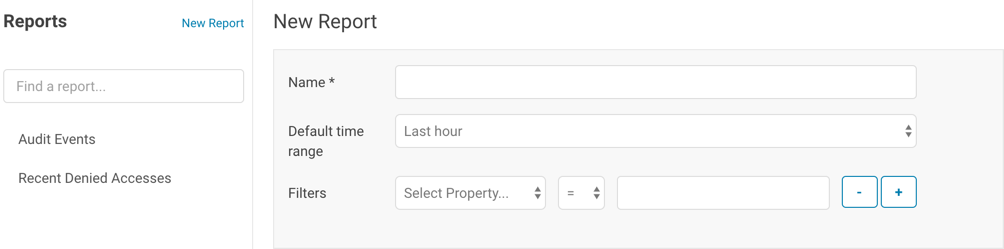
- Enter a report name.
- In the Default time range field, specify a relative time range. If you had specified a custom absolute time range before selecting Save As Report, the custom absolute time range is discarded.
- Optionally add filters (seeFiltering Audit Events in the Console).
- Click Save.
Editing Audit Event Reports
- In the left pane, click a report name.
- Click Edit Report.
- In the Default time range field, specify a relative time range. If you had specified a custom absolute time range before selecting Save As Report, the custom absolute time range is discarded.
- Optionally add filters (seeFiltering Audit Events in the Console).
- Click Save.
Downloading Audit Event Reports
- timestamp
- service
- username
- ipAddress
- command
- resource
- allowed
- [operationText]
- serviceValues
In addition to downloading audit events, you can configure the Navigator Audit Server to publish audit events to a Kafka topic or syslog. See Publishing Audit Events.
Downloading Audit Event Reports from
- Do one of the following:
- Add filters ((seeFiltering Audit Events in the Console).
- In the left pane, click a report name.
- Select , where format is CSV or JSON.
Downloading Audit Events Using the Audit API
You can filter and download audit events using the Cloudera Navigator APIs.Hive Audit Events Using the Audit API
To use the API to download the audits events for a service named hive, use the audits endpoint with the GET method:
http://fqdn-n.example.com:port/api/APIversion/audits/?parameterswhere fqdn-n.example.com is the host running the Navigator Metadata Server role instance listening for HTTP connections at the specified port number (7187 is the default port number). APIversion is the running version of the API as indicated in the footer of the API documentation (available from the Help menu in the Navigator console) or by calling http://fqdn-n.example.com:port/api/version.
For example:
curl http://node1.example.com:7187/api/v13/audits/?query=service%3D%3Dhive\
&startTime=1431025200000&endTime=1431032400000&limit=5&offset=0&format=JSON&attachment=false\
-X GET -u username:password
The startTime and endTime parameters are required and must be specified in epoch time in milliseconds.
The request could return the following JSON items:
[ {
  "timestamp" : "2015-05-07T20:34:39.923Z",
  "service" : "hive",
  "username" : "hdfs",
  "ipAddress" : "12.20.199.170",
  "command" : "QUERY",
  "resource" : "default:sample_08",
  "operationText" : "INSERT OVERWRITE \n  TABLE sample_09 \nSELECT \n  sample_07.code,sample_08.description \n  FROM sample_07 \n  JOIN sample_08 \n  WHERE sample_08.code = sample_07.code",
  "allowed" : true,
  "serviceValues" : {
    "object_type" : "TABLE",
    "database_name" : "default",
    "operation_text" : "INSERT OVERWRITE \n  TABLE sample_09 \nSELECT \n  sample_07.code,sample_08.description \n  FROM sample_07 \n  JOIN sample_08 \n  WHERE sample_08.code = sample_07.code",
    "resource_path" : "/user/hive/warehouse/sample_08",
    "table_name" : "sample_08"
  }
}, {
  "timestamp" : "2015-05-07T20:33:50.287Z",
  "service" : "hive",
  "username" : "hdfs",
  "ipAddress" : "12.20.199.170",
  "command" : "SWITCHDATABASE",
  "resource" : "default:",
  "operationText" : "USE default",
  "allowed" : true,
  "serviceValues" : {
    "object_type" : "DATABASE",
    "database_name" : "default",
    "operation_text" : "USE default",
    "resource_path" : "/user/hive/warehouse",
    "table_name" : ""
  }
}, {
  "timestamp" : "2015-05-07T20:33:23.792Z",
  "service" : "hive",
  "username" : "hdfs",
  "ipAddress" : "12.20.199.170",
  "command" : "CREATETABLE",
  "resource" : "default:",
  "operationText" : "CREATE TABLE sample_09 (code string,description string) ROW FORMAT DELIMITED FIELDS TERMINATED BY '\\t' STORED AS TextFile",
  "allowed" : true,
  "serviceValues" : {
    "object_type" : "DATABASE",
    "database_name" : "default",
    "operation_text" : "CREATE TABLE sample_09 (code string,description string) ROW FORMAT DELIMITED FIELDS TERMINATED BY '\\t' STORED AS TextFile",
    "resource_path" : "/user/hive/warehouse",
    "table_name" : ""
  }
} ]