Use the widgets on
Dashboard Metrics to monitor cluster-wide metrics.
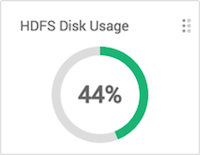
On the Metrics page, multiple widgets
represent operating status information of your cluster. Most widgets display a single
metric, such as HDFS Disk Usage:
-
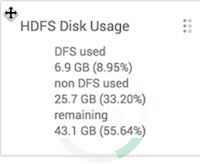
Hover your cursor over a Metrics widget.
A pop up window displays more details, if available.
-
Click the edit widget icon

to export, modify or remove a widget from the
Metrics page.
-
For cluster-wide metrics, such as Memory, Network or CPU Usage, click
Save as CSV or Save as JSON to
export metrics data.
-
Click Edit to modify the display of information in a
widget.
-
Click Delete to remove the widget from the Dashboard.

