

Open the cluster dashboard
Use the Ambari Web Dashboard to monitor operating status of your cluster.
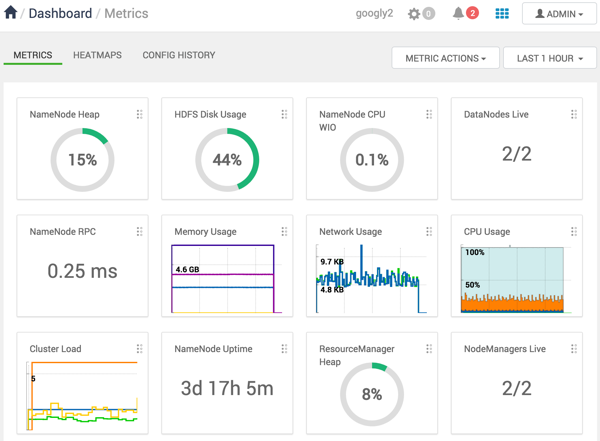
In Ambari Web, click Dashboard to view the operating status
of your cluster.
Dashboard includes three options:
- Metrics
- Heatmaps
- Config History
Metrics Widgets and Descriptions:
HDFS metrics
- HDFS Disk Usage
- The percentage of distributed file system (DFS) used, which is a combination of DFS and non-DFS used
- Data Nodes Live
- The number of DataNodes operating, as reported from the NameNode
- NameNode Heap
- The percentage of NameNode Java Virtual Machine (JVM) heap memory used
- NameNode RPC
- The average RPC queue latency
- NameNode CPU WIO
- The percentage of CPU wait I/O
- NameNode Uptime
- The NameNode uptime calculation
YARN metrics (HDP 2.1 or later stacks)
- ResourceManager Heap
- The percentage of ResourceManager JVM heap memory used
- ResourceManager Uptime
- The ResourceManager uptime calculation
- NodeManagers Live
- The number of DataNodes operating, as reported from the ResourceManager
- YARN Memory
- The percentage of available YARN memory (used versus. total available)
HBase metrics
- HBase Master Heap
- The percentage of NameNode JVM heap memory used
- HBase Ave Load
- The average load on the HBase server
- HBase Master Uptime
- The HBase master uptime calculation
- Region in Transition
- The number of HBase regions in transition
Storm metrics (HDP 2.1 or later stacks)
- Supervisors Live
- The number of supervisors operating as reported by the Nimbus server