Managing and Monitoring a Cluster
Also available as:
PDF
loading table of contents...

View cluster health

Filter Dashboard > Metrics to see only metrics that reflect overll cluster health.

From Dashboard > Metrics, you can filter the dashboard to display only cluster-wide metrics. For example, you can customize the dashboard to hide all except the following widgets:

Additional options include:

  • From a widget legend, click Delete to remove the widget from Metrics.
    Deleting a widget from Metrics hides the widget from view. To replace it, add the widget, using Metric Actions.
  • For cluster-wide metrics, hover the cursor over the chart, then click the magnifying glass icon to zoom in.
  • Hover your cursor over a widget to magnify the chart or itemize the widget display.
    A larger version of the widget displays in a separate window. You can use the larger view in the same ways that you use the dashboard.
  • Click OK to close the larger view.


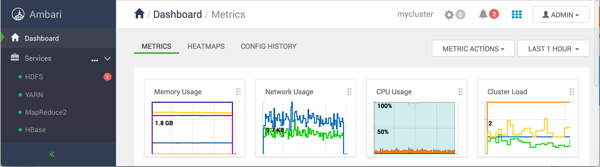
Cluster-wide metrics include:

Memory usage

Cluster-wide memory used, including memory that is cached, swapped, used, and shared

Network usage

The cluster-wide network utilization, including in-and-out

CPU Usage

Cluster-wide CPU information, including system, user and wait IO
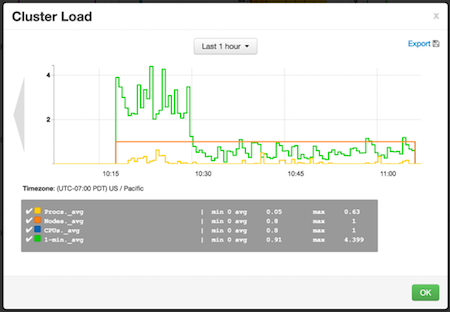
Cluster Load

Cluster-wide Load information, including total number of nodes. total number of CPUs, number of running processes and 1-min Load