

View cluster heatmaps
The Ambari Web Heatmaps page provides a graphical representation of your overall cluster utilization, using simple color coding known as a heatmap.
Hovering over a block that represents a host displays more detailed information
about that specific host.
A separate window displays metrics about components installed on that
host.
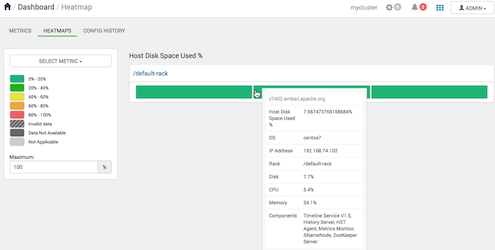
If any data necessary to determine usage is not available, the block displays
Invalid data.
You can select a different heatmap, using the Select Metric
menu.
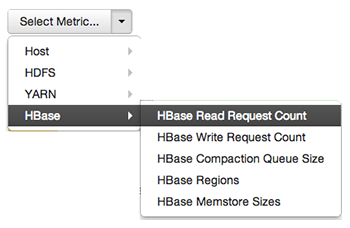
Heatmaps supports the following metrics:
- Host/Disk Space Used %
- disk.disk_free and disk.disk_total
- Host/Memory Used %
- memory.mem_free and memory.mem_total
- Host/CPU Wait I/O %
- cpu.cpu_wio
- HDFS/Bytes Read
- dfs.datanode.bytes_read
- HDFS/Bytes Written
- dfs.datanode.bytes_written
- HDFS/Garbage Collection Time
- jvm.gcTimeMillis
- HDFS/JVM Heap MemoryUsed
- jvm.memHeapUsedM
- YARN/Garbage Collection Time
- jvm.gcTimeMillis
- YARN / JVM Heap Memory Used
- jvm.memHeapUsedM
- YARN / Memory used %
- UsedMemoryMB and AvailableMemoryMB
- HBase/RegionServer read request count
- hbase.regionserver.readRequestsCount
- HBase/RegionServer write request count
- hbase.regionserver.writeRequestsCount
- HBase/RegionServer compaction queue size
- hbase.regionserver.compactionQueueSize
- HBase/RegionServer regions
- hbase.regionserver.regions
- HBase/RegionServer memstore sizes
- hbase.regionserver.memstoreSizeMB