Creating a Data Visualization dashboard by importing visual artifacts
To visualize the correlation and share the insights with your stakeholders, you can
manually create a dashboard in Cloudera Data Visualization (CDV) or use a visual artifact in
the form of a JSON file and import it in CDV.
For the Business Intelligence at Scale pattern, use the
"cdv-dashboard-Effect-of-Weather-on-Sales.json" script provided as part of the download
package to create the tables required for generating dashboard.
Log in to the CDP web interface.
Go to Data Warehouse.
Locate your Impala Virtual Warehouse and click on Data
VIZ.
Click DATA on the main navigation bar.
All Connections and the available
Datasets are displayed.
Click on Default Impala VW from the left navigation
pane.
Click at the top of the page and
click Import Visual Artifacts.
On the Import Visual Artifacts pop-up, click
Choose File and select the file you want to
import.
Specify the destination workspace in the Import to
Workspace drop-down menu.
By default, Data Visualization imports the visual artifacts into your
Private workspace. However, you can choose the Public
workspace, or another workspace.
Select Import from the file from the
Thumbnail Action drop-down menu.
Click IMPORT and confirm by clicking ACCEPT
AND IMPORT.
After the import completes, a success message appears on the
Import interface. All the artifacts have an assigned ID,
which are generated by the system, sequentially. Visuals/Dashboards and datasets have
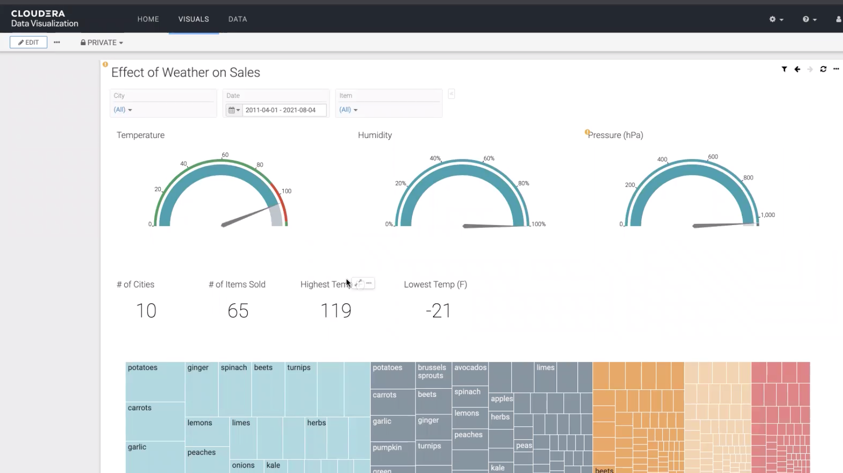
separate ID queues.Completing this task for your Business Intelligence at Scale pattern results in a
dashboard that looks similar to the following example:Now that you have created your Business Intelligence at
Scale pattern dashboard, share it with other stakeholders.
Open your dashboard from the VISUAL interface.
Click the more option and select Get URL.
Copy the URL by right-clicking it and share it with your stakeholders.
 at the top of the page and
click Import Visual Artifacts.
at the top of the page and
click Import Visual Artifacts.