Monitoring Data Warehouse service resources with Grafana dashboards
Grafana is visualization and analytics software that enables the development of
dashboards to monitor metrics data. You can access pre-built Grafana dashboards to monitor
Virtual Warehouses and your compute cluster in Cloudera Data Warehouse (CDW).
You connect to prebuilt dashboards to view metrics of CDW operations. Cloudera provides
prebuilt Grafana dashboards for Hive, Impala, and Hue dashboards of metrics data, charts, and
other visuals.
Using Grafana, CDP metrics are centralized in a single spot, stored in the Prometheus
database, and monitored by Prometheus. Your workload databases are not involved in any way.
You can immediately view the following pre-built dashboards:
Hive dashboards
The Hive dashboards cover the following operations of the Hive SQL engine in CDW:
Auto-scaling
Hive metastore
HiveServer
The Hive service itself (Hive-Home)
LLAP
Impala dashboards
The Impala dashboards include the following operations of the Impala SQL engine in
CDW:
Catalog server
Coordinator
Executor
Statestore
The Impala service itself
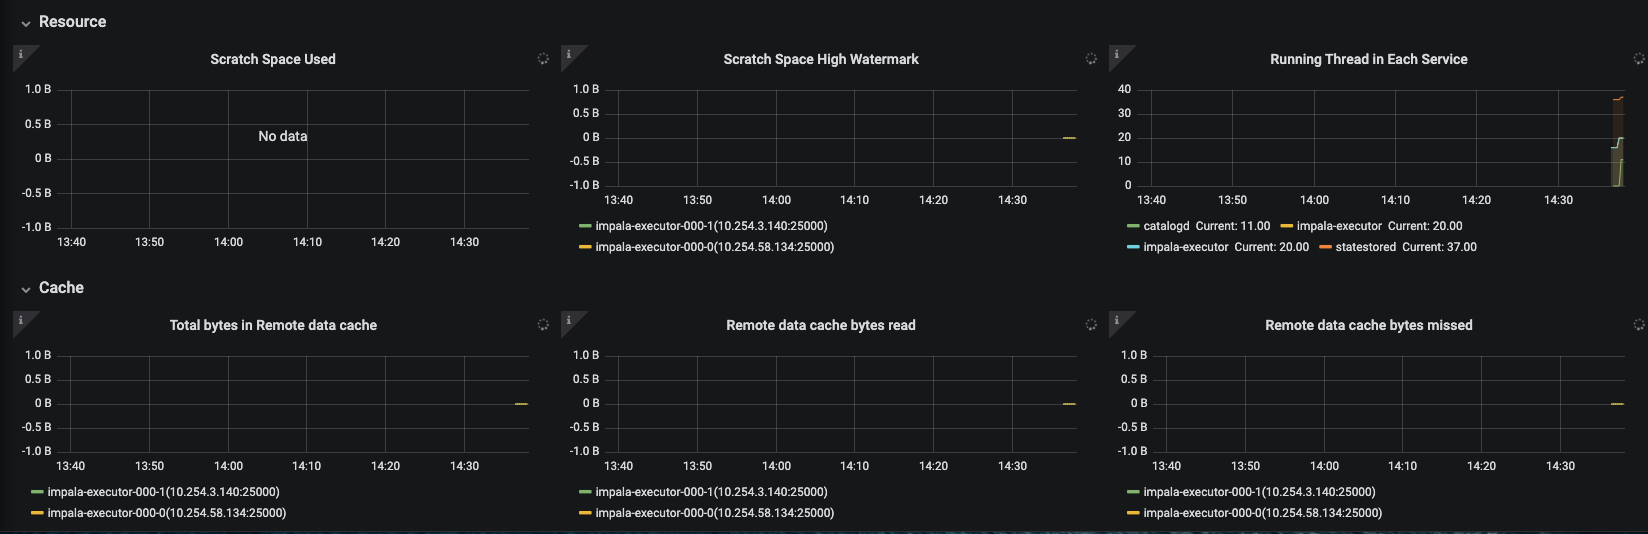
The following screenshot shows the available scratch and cache disk utilization graphs for
the Impala Virtual Warehouse:
You can view dashboard metrics for different time periods by selecting the period of interest
from the time range dropdown in the horizontal navigation.
On the Embedded Container Service (ECS) platform, you can view the CPU, memory,
network usage, and disk input-output for each CDW node using the
[***ENVIRONMENT-NAME***]-Nodes option. You can also expand the individual dashboards to see
more details, as described in the following table:
Dashboard name
Description
Available metrics
CPU
CPU utilization per node
Usage per node
Usage per user
Usage per system
Idle time
IO wait
Memory
Memory utilization per node
Usage per node
Buffer cache
Page cache
Total, used, and available
Network
Number of bytes and packets sent and received
Network transmitted
Network received
Network transmitted by an interface
Network received by an interface
Disk
Disk bytes read and written
Bytes written
Bytes read
IO wait time
We want your opinion
How can we improve this page?
What kind of feedback do you have?
This site uses cookies and related technologies, as described in our privacy policy, for purposes that may include site operation, analytics, enhanced user experience, or advertising. You may choose to consent to our use of these technologies, or