Monitoring Individual Models
When a model is deployed, Cloudera Data Science Workbench allows you to specify a number of replicas that will be deployed to serve requests.
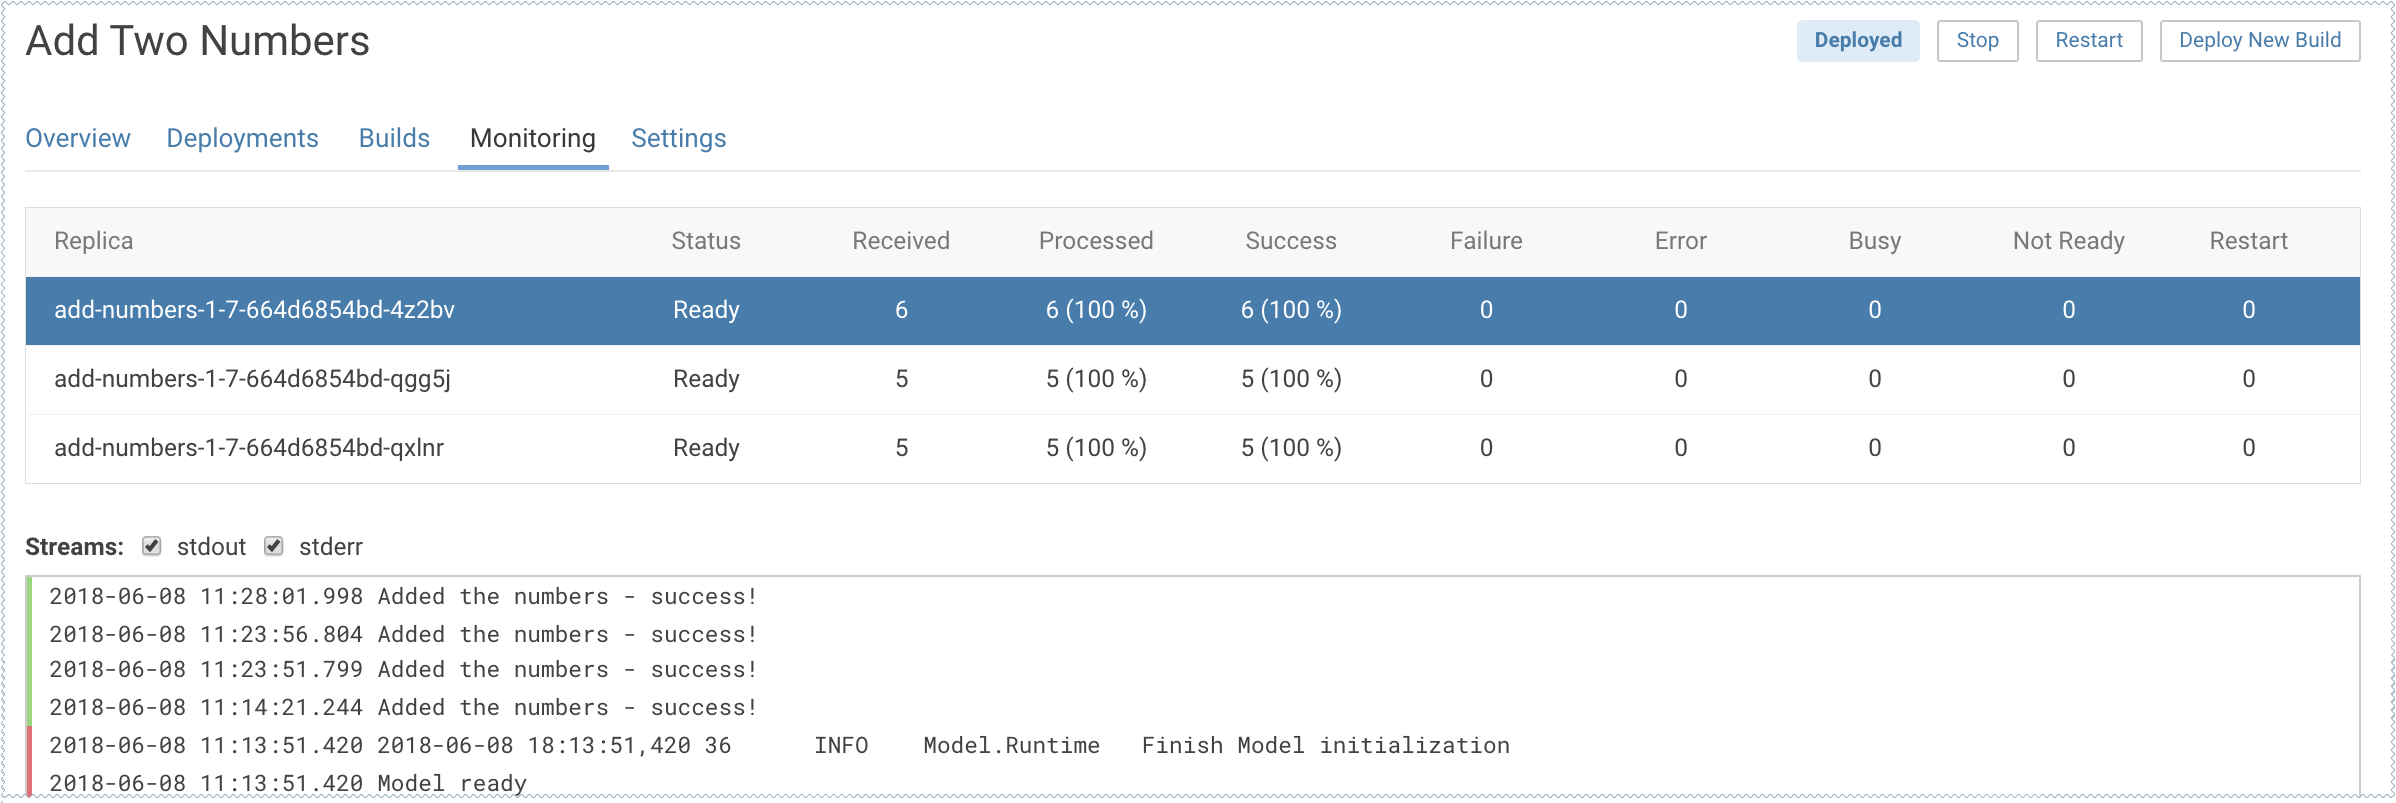
For each active model, you can monitor its replicas by going to the
model's Monitoring page. On this
page you can track the number of requests being served by each replica, success and failure
rates, and their associated stderr and
stdout logs. Depending on future resource
requirements, you can increase or decrease the number of replicas by re-deploying the
model.
The most recent logs are at the top of the pane (see image). stderr logs are displayed next to a red bar while
stdout logs are by a green bar. Note that
model logs and statistics are only preserved so long as the individual replica is active. When
a replica restarts (for example, in case of bad input) the logs also start with a clean slate.