Building a dashboard
In Superset, you can create a Druid data dashboard using Superset visualizations that you save.
- You are running the Druid and Superset services in Ambari.
- You ingested data, such as the Wikipedia data from the Wikiticker example, into Druid.
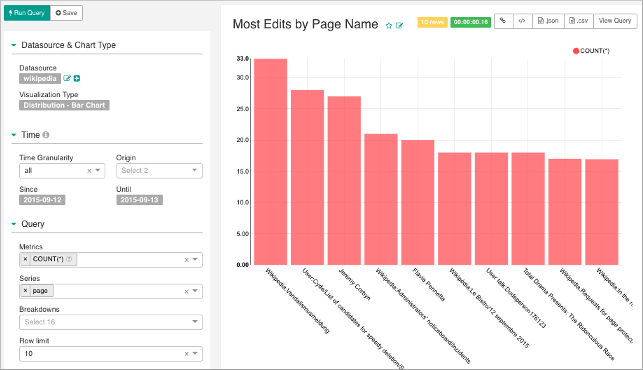
- You created a Superset bar chart view of some of the data and a table view of some other data.
-
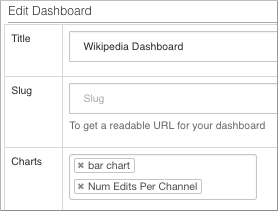
Click Dashboards > Add a New Record
 ,
enter a title: Wikipedia Dashboard, for example.
,
enter a title: Wikipedia Dashboard, for example.
-
In Charts, browse to and select Superset results of queries you saved.
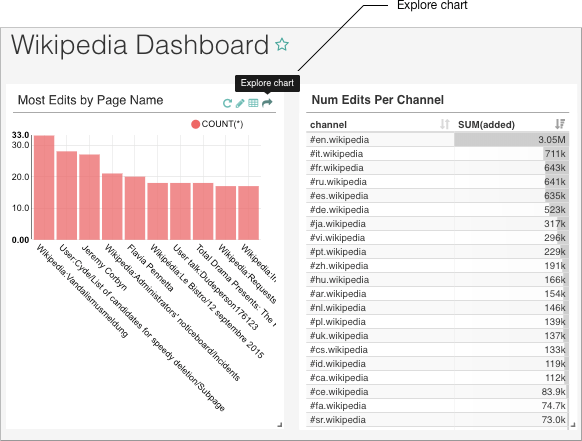
For example, select the bar chart and the table view Num Edits Per Channel.
-
On the bar chart, click Explore the Chart.
 The Data Source & Chart Type dialog re-appears. You can view or edit the definition of the chart.