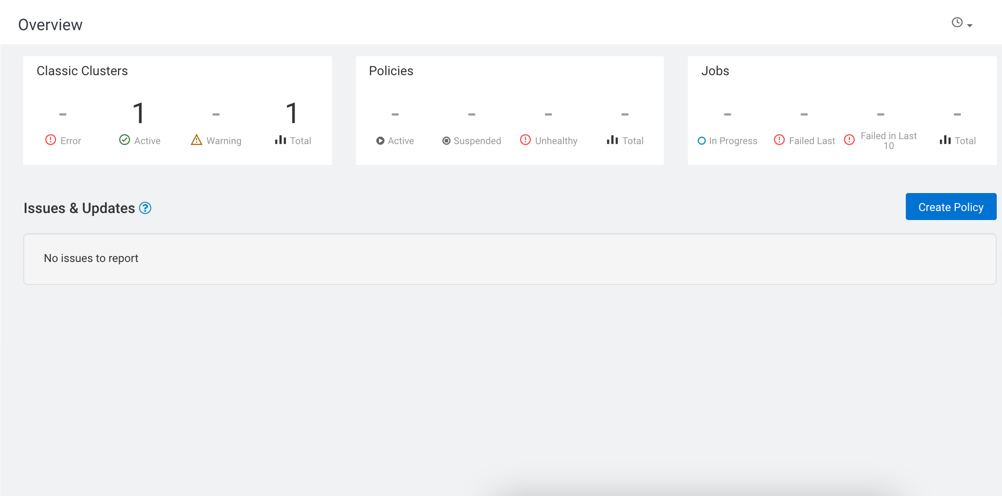
Overview
When you click Replication Manager on the Cloudera on cloud web interface, the Overview page appears. The page provides a snapshot of the Replication Manager service. It provides insights into issues and updates related to various entities and resources through dashboards like Classic Clusters, Replication Policies, Notifications, and so on.
The following panels appear on the Overview page:
- Classic Clusters
- Policies
- Jobs
- Issues & Updates
Click Create Policy to create a replication policy.
Classic Clusters
The Classic Clusters panel on the Overview page tracks the total number of clusters enabled for Replication Manager, the number of clusters that are in an error state, the number of clusters that are active, and the number of clusters for which a warning is issued.
You must register your existing on-premises Cloudera Distribution of Hadoop (CDH) and Cloudera Base on premises clusters on the Cloudera Management Console, after which you can copy or move your data to the cloud. In Cloudera on cloud, these clusters are called classic clusters.
- Active clusters that are currently available to run the replication jobs.
- Clusters having less than 10% disk capacity appears as Warning. Click the number to open a table to track the cluster name and the exact disk capacity remaining.
- Total number of clusters that are in use.
- Number of clusters that are currently not running as expected or in Error state.
To investigate the issues associated with clusters that have an error or warning status, use Cloudera Manager for on-premises clusters.
Policies
The Policies panel on the Overview page tracks the number of replication policies that are in use and their status.
- Active replication policies in Submitted state or Running state. This item is not actionable.
- Replication policies that are Suspended by the administrator. This item is not actionable.
- Unhealthy replication policies that are associated with a cluster designated as Error on the Classic Clusters panel. Click the number to find out the policy names, the names of its associated source clusters and destination clusters, and the services that have stopped on the source cluster or destination cluster.
- Total number of running policies.
When you click Policies on the Overview page, the Replication Policies page appears. On this page, you can view the replication policy details.
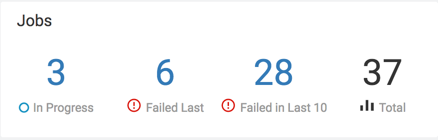
Jobs
The Jobs panel on the Overview page tracks the total number of running and failed jobs and their status in Replication Manager.
- In Progress jobs or jobs in running state.
- Failed Last replication policies are the policies for which the last job failed to complete.
- Failed in Last 10 replication policies are the policies for which at least one of the last ten jobs failed.
- Total number of available jobs.
You can click the number in the panel to apply a filter to the Issues & Updates table to view the required policies.
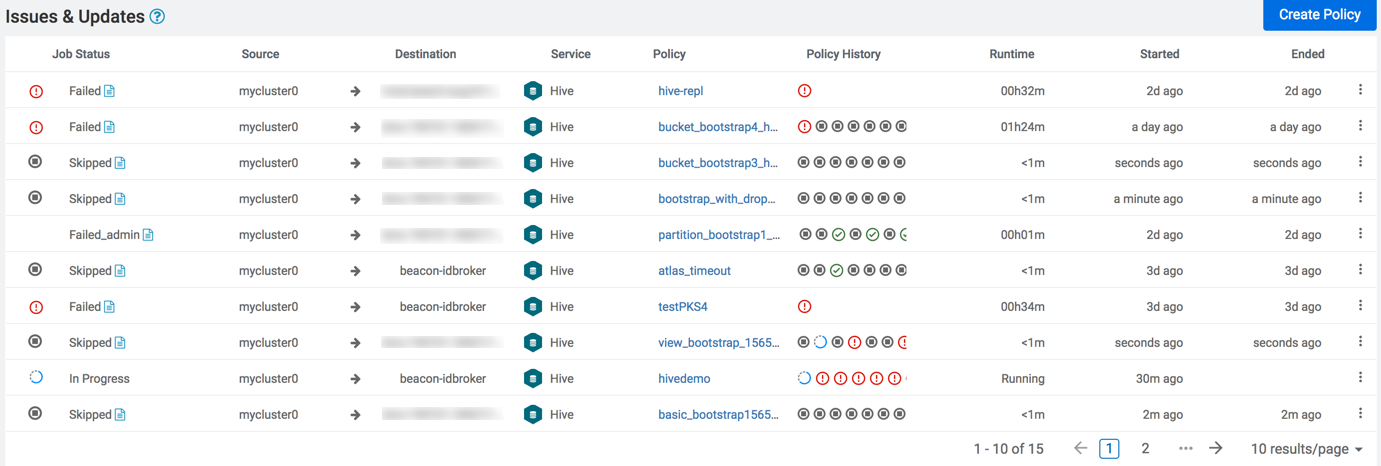
Issues & Updates
The Issues & Updates panel lists the replication policies that have running jobs with at least one job in Failed status in the most recent ten jobs. If you do not see any policy, it indicates that the last ten jobs of all the replication policies were successful.
- Current Job Status of the job. When the job status is running, the status circle icon and a progress bar appear. For jobs that are not running, the status circle icon appears with Success, Failed, or Ignored text. Hover over the Failed status and click View Log to view the job log.
- Source cluster associated with the replication policy.
- Destination cluster associated with the policy.
- Service indicates whether the data being replicated is HDFS, Hive, or HBase.
- Replication Policy name.
- Policy History of the last ten job statuses. The column also
shows the status as colored dots which you can click to view the policy details on
the Policies page:
- Green indicates that the job completed successfully.
- Red indicates that the job did not complete.
- Gray indicates that the job did not start because a previous instance of the policy is still in progress. Only one run of a job can be in progress at one time. If a job is consistently ignored, edit the replication policy to modify its frequency.
When you click the colored dots, the page appears with the filter preset to show the information about the specified policy.
- Transferred/Files is the amount of data transferred, in gigabytes, and the number of objects transferred, if available. When a job is running, the column shows In Progress.
- Runtime or time taken to complete the most recent job.
- Most recent job that Started.
- Most recent job that Ended.
- Abort Job aborts a running job.
- Re-run Job starts another instance of the policy. This option is not available for running jobs.
- Edit Policy settings. This option is not available for expired policies.
- Delete Policy removes the replication policy permanently. The delete operation cannot be undone.
- Suspend Policy only if the job is running.
- Activate Policy resumes a suspended replication policy.