Creating triggers and monitoring replication-related metrics in Cloudera Manager
After you create an HBase replication policy between two Cloudera Operational Database (COD) clusters in Cloudera Replication Manager, you can set up the triggers in Cloudera Manager to monitor specific replication-related metrics for the HBase replication policy. When the condition specified in the trigger is met, Cloudera Manager triggers an alert, and you can view the metrics for the replication policy in Cloudera Replication Manager and in Cloudera Manager.
-
Enter the required values and the following expression to create a trigger for
a metric with a certain threshold value on the Create New
Trigger page:
IF (SELECT [***ENTER THE METRIC NAME***] WHERE serviceName=$SERVICENAME AND max([***ENTER THE METRIC NAME***]) > [***ENTER THE THRESHOLD VALUE***] AND roleType=RegionServer) DO health:concerningThe following examples illustrate how you can use triggers to monitor the replication metrics in Cloudera Manager:
-
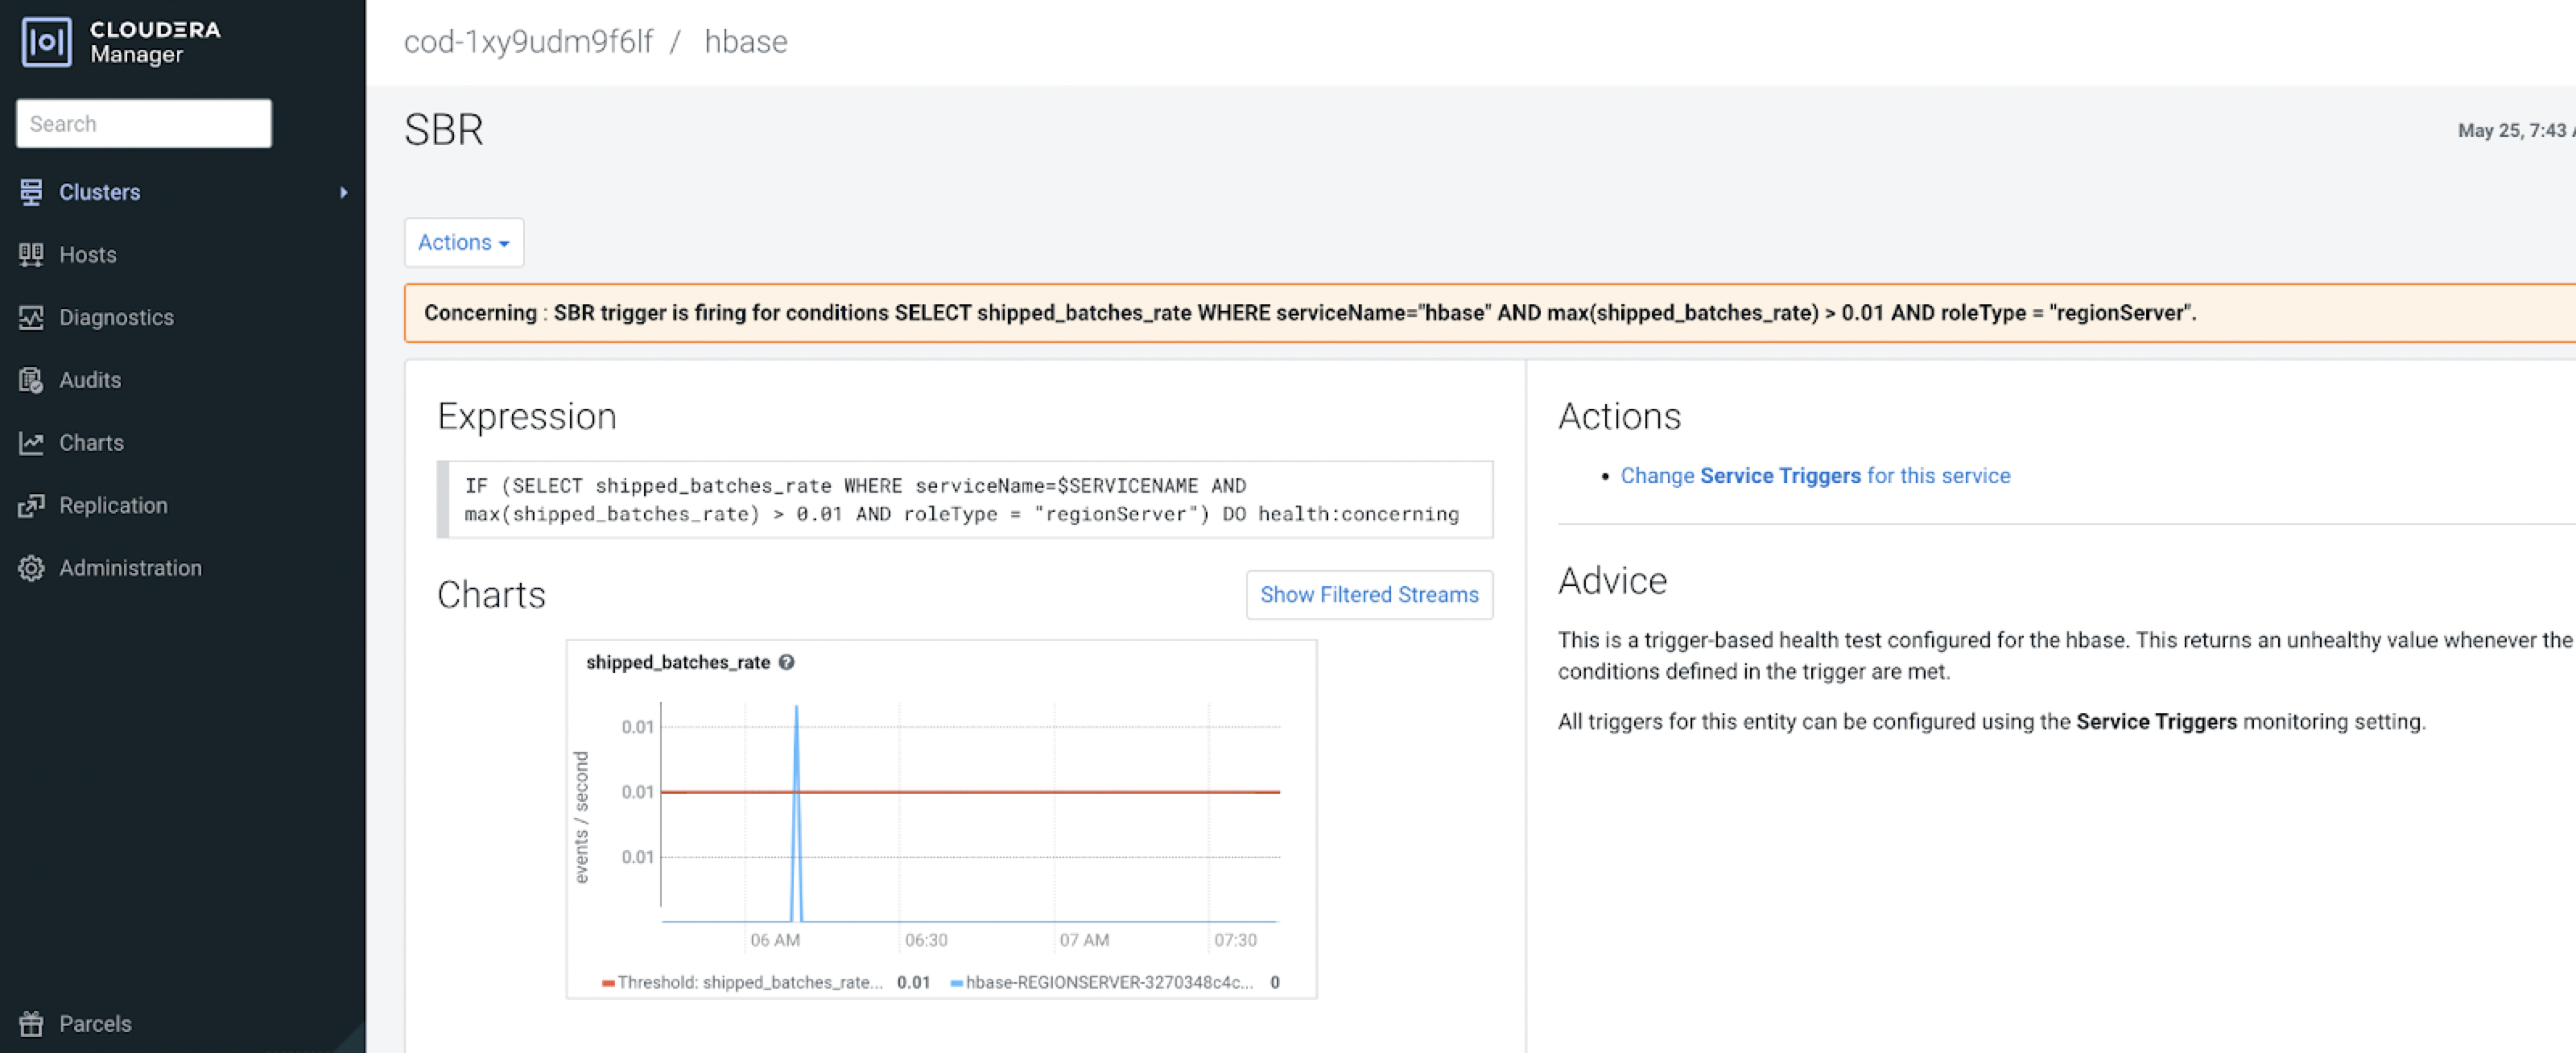
The following sample image shows the chart that appears on the page when the health alert is triggered for the following
trigger expression: IF (SELECT shipped_batches_rate WHERE
serviceName=$SERVICENAME AND max(shipped_batches_rate) > 0.01 AND
roleType=RegionServer) DO health:concerning
-
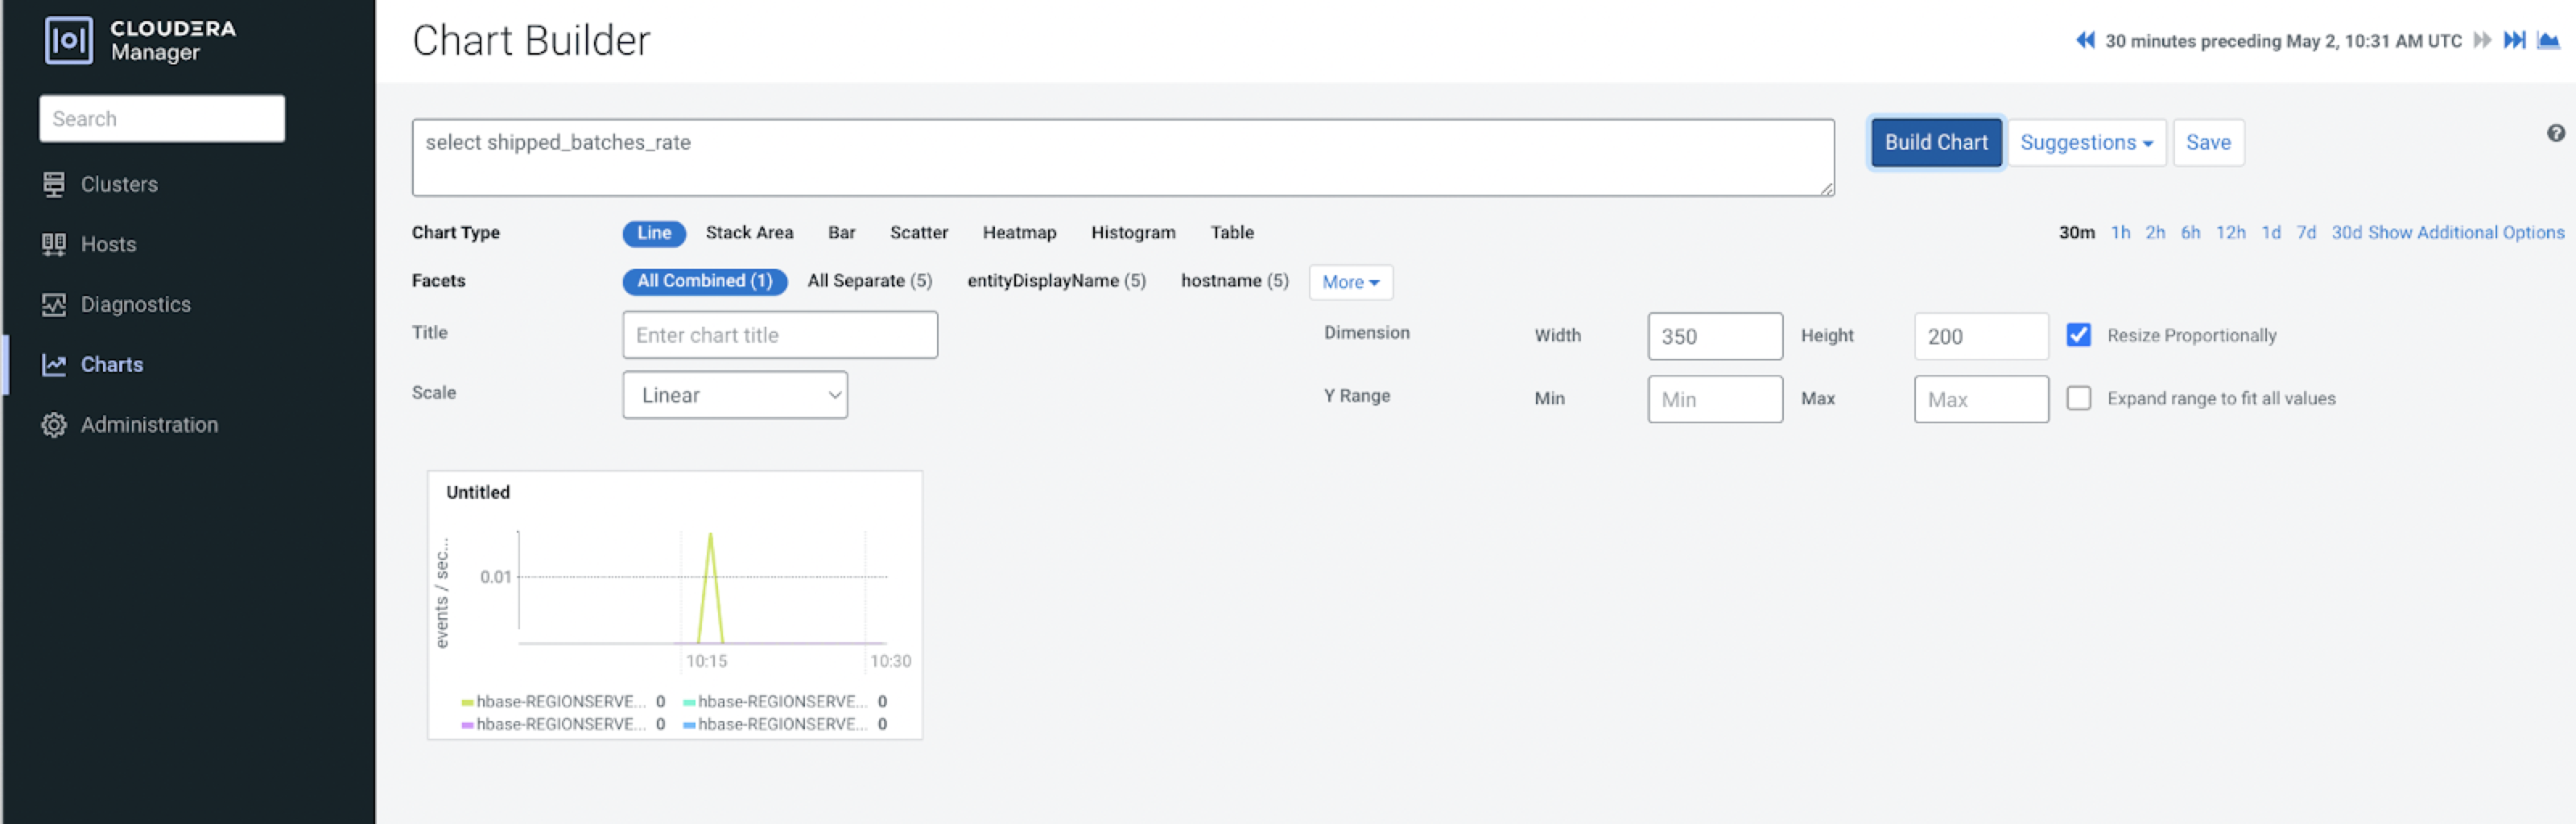
The following image shows the Chart Builder where
you can configure the options as required and save it for
troubleshooting purposes or for future references.
For information about monitoring the metrics related to replication and HBase health on your COD environment, see Monitor COD metrics.
-
The following sample image shows the chart that appears on the page when the health alert is triggered for the following
trigger expression: IF (SELECT shipped_batches_rate WHERE
serviceName=$SERVICENAME AND max(shipped_batches_rate) > 0.01 AND
roleType=RegionServer) DO health:concerning