Monitor Cloudera Operational Database metrics
You can monitor your Cloudera Operational Database service using the charts in the Cloudera Operational Database user interface.
You can access the charts in the Cloudera Operational Database user interface. You have to navigate to .
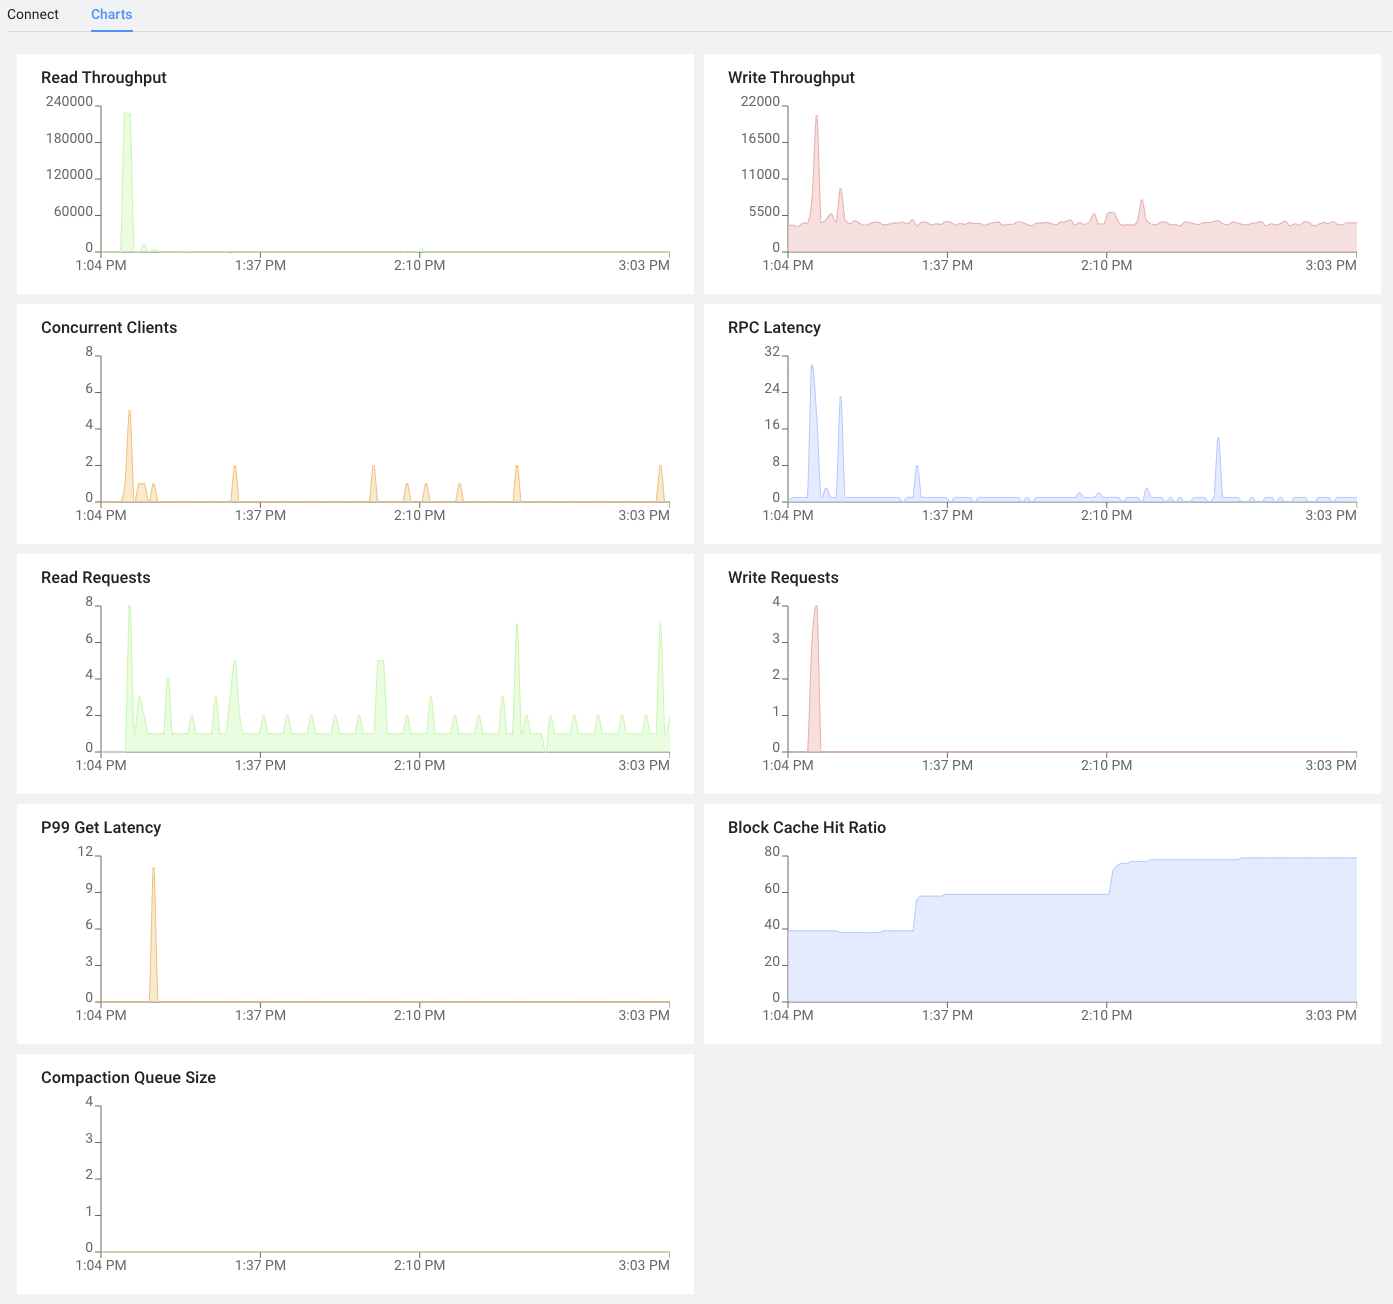
The charts provide you with the following information:
- Read Throughput: Read throughput over time. The throughput per node greatly depends on table cell size and data request patterns.
- Write Throughput: Write throughput over time.
- Concurrent Clients: Number of clients currently connected to the database.
- RPC Latency: Latency when receiving or sending bytes from the RPC in the RegionServer.
- Read Requests: Total number of read requests per second.
- Write Requests: Total number of write requests per second.
- P99 Get Latency: 99th percentile of Get operation latency.
- Block Cache Hit Ratio: The percent of the time that requests with the block cache turned on hit the block cache.
- Compaction Queue Size: Size of the compaction queue.