
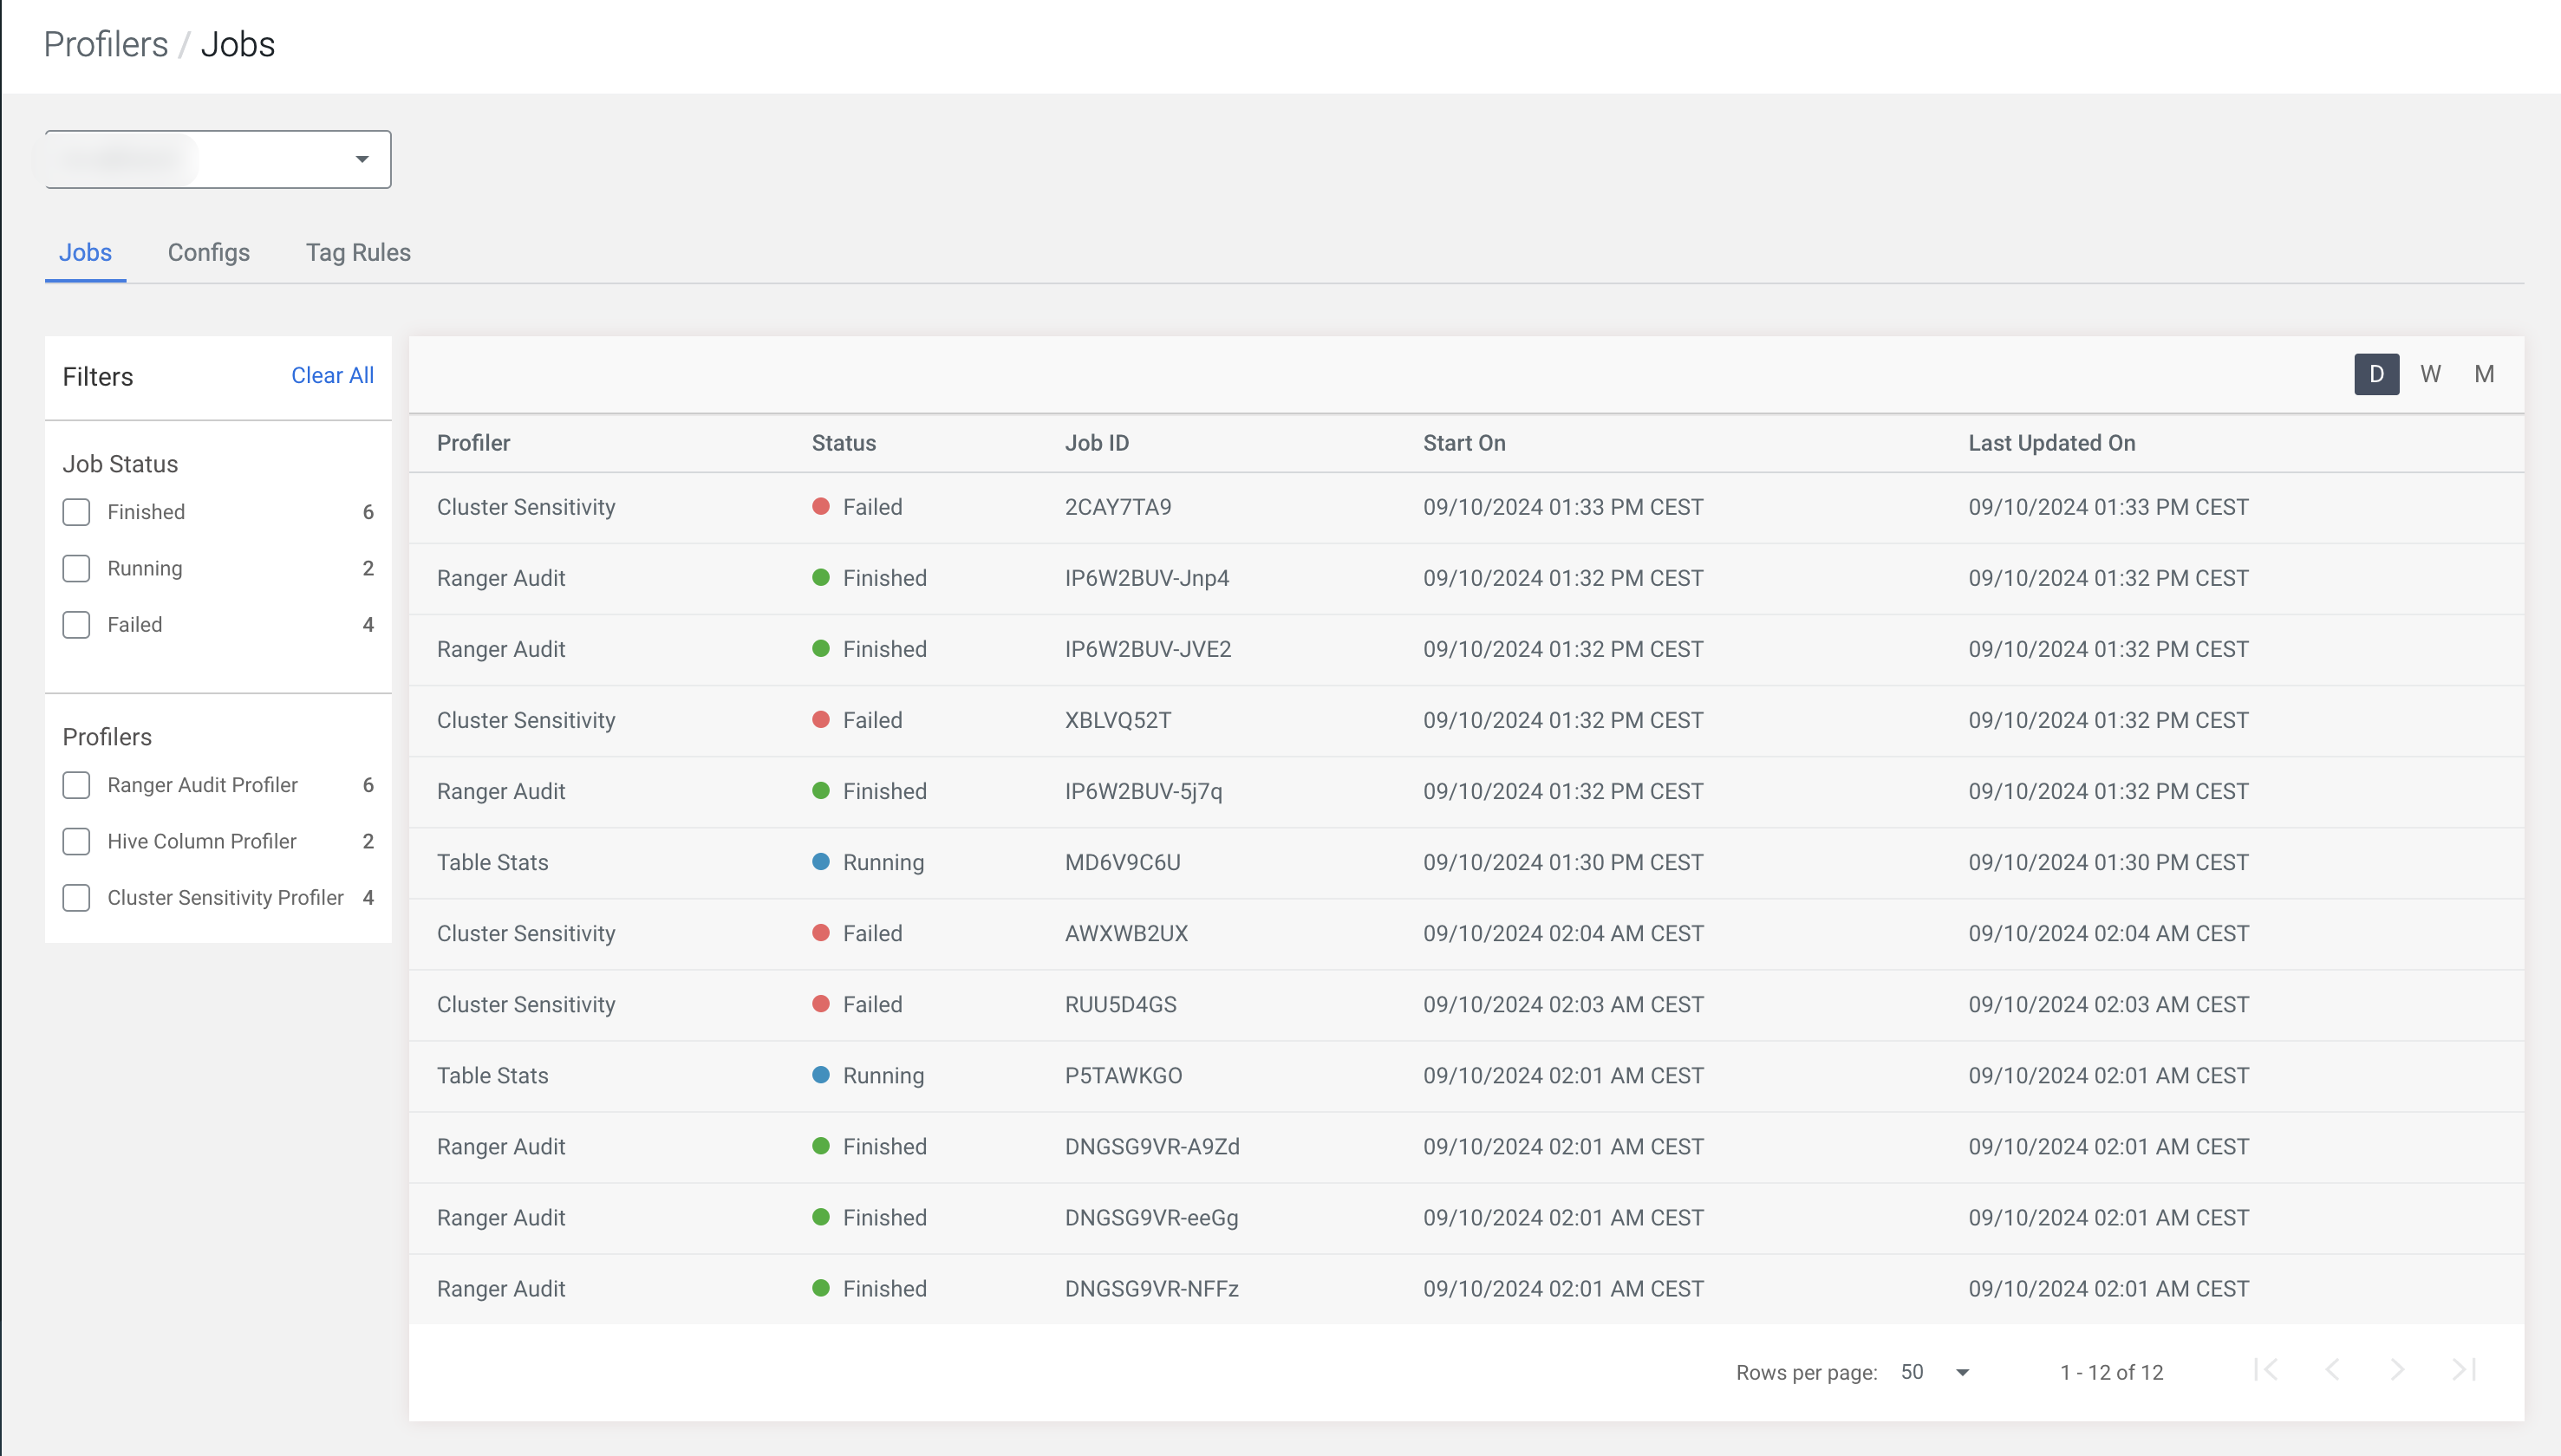
Tracking profiler jobs
Use the Profilers > Jobs page for tracking respective profiler jobs.
Under , you can have an overview of your started profiler jobs. By using the D, W, M filters, you can go back up to a day, week or a moth, to see your previous jobs. Use this page to quickly check if your profiler jobs are failing.
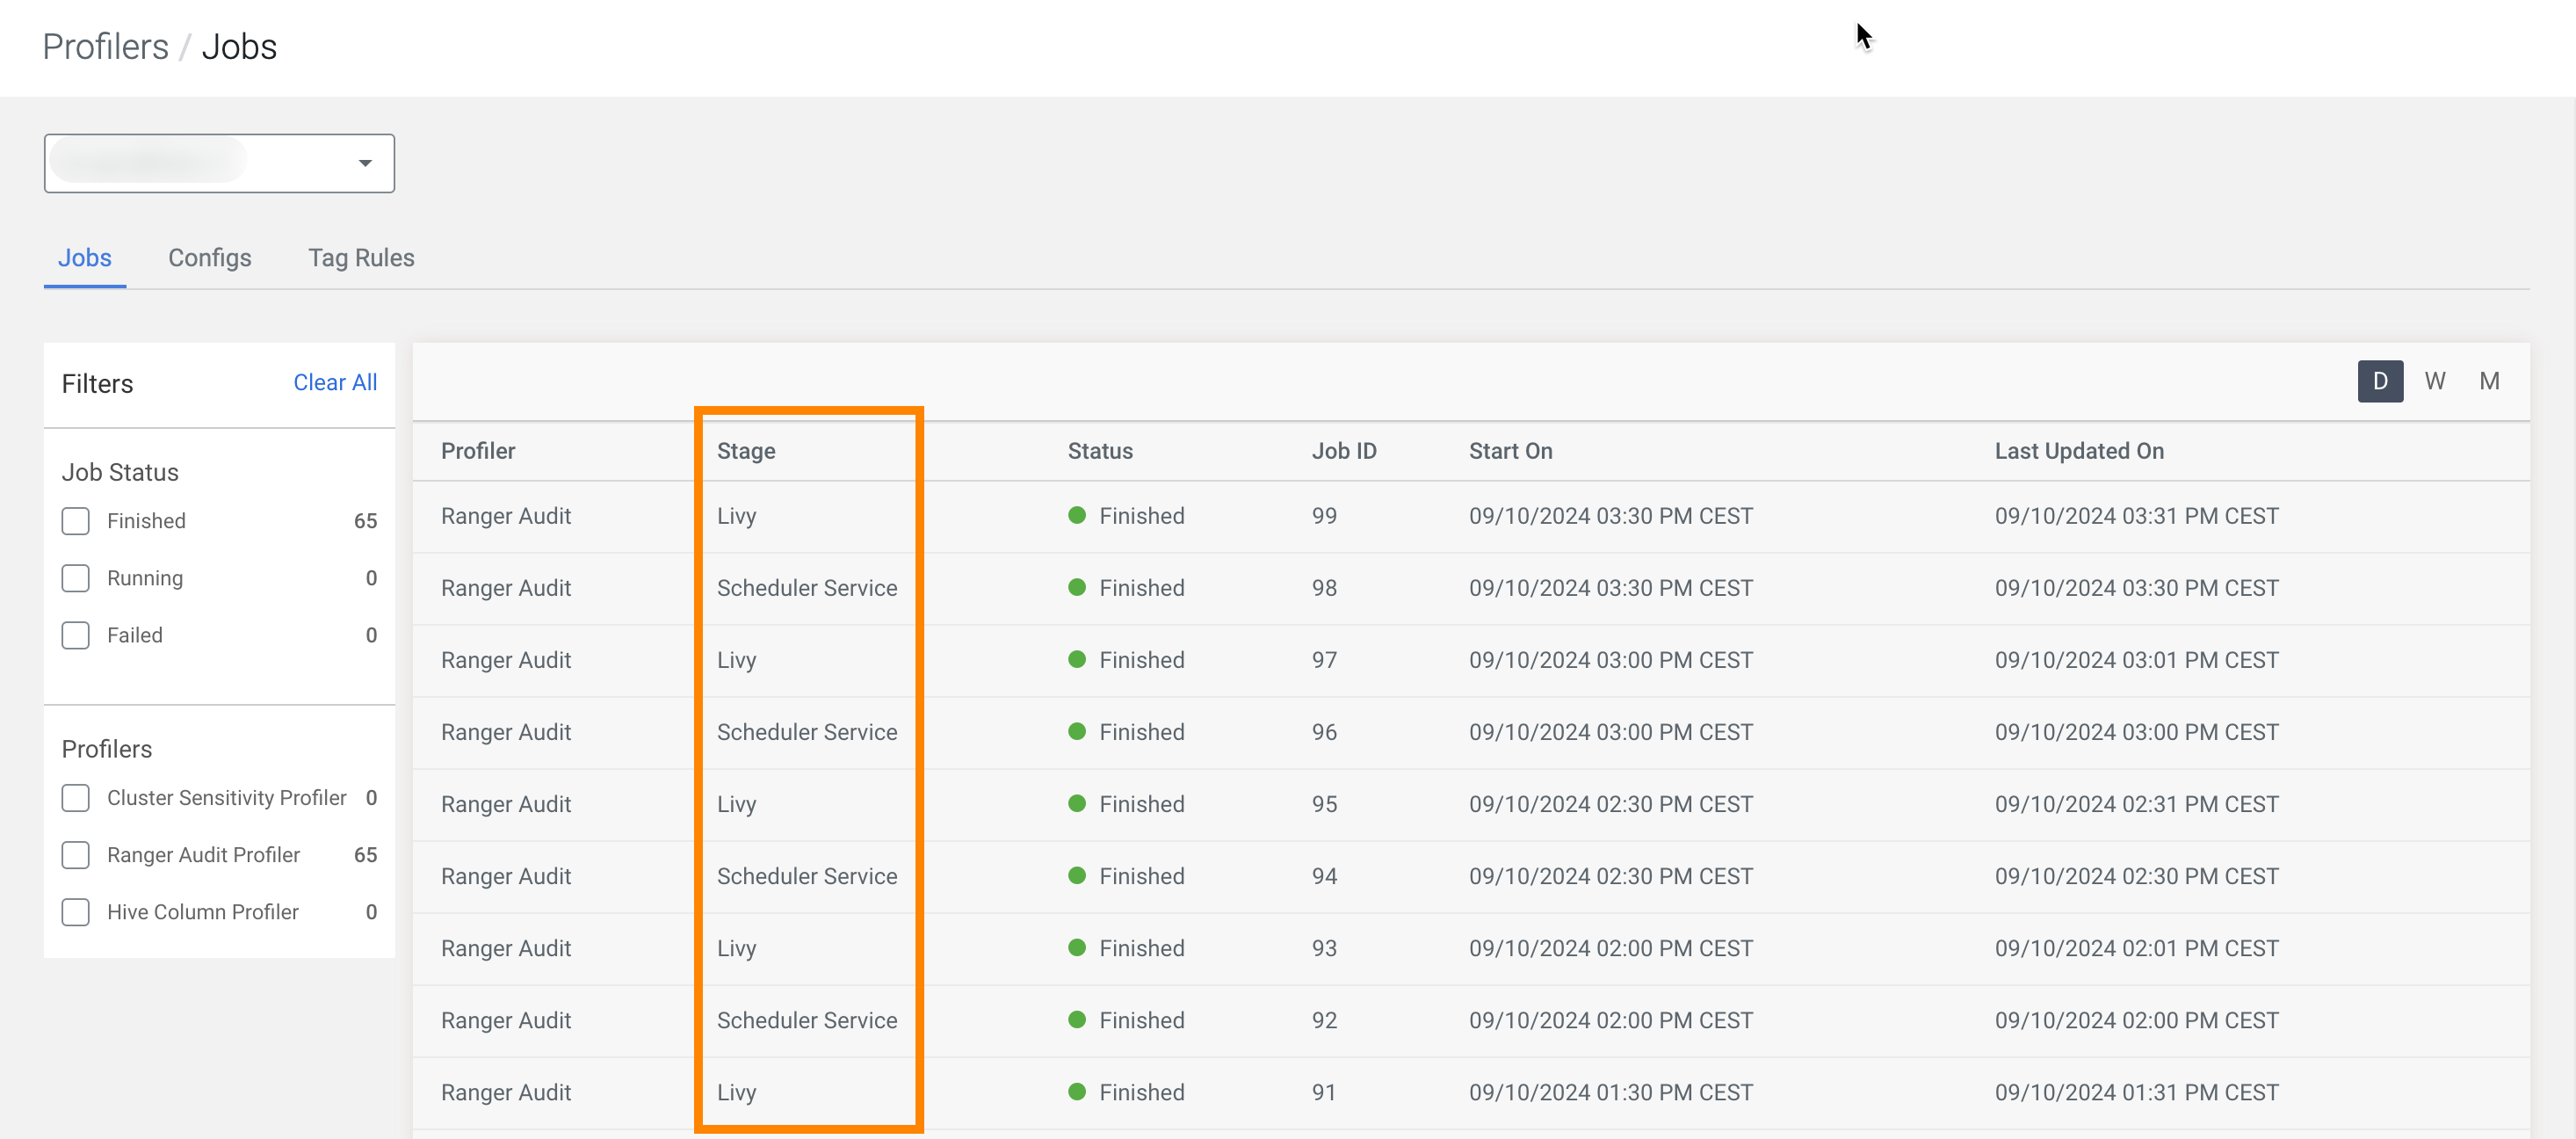
In VM-based environments, can show you the current profiling Stage based on the relevant service used:
For each profiler job, you can view the details about:
- Profiler type
- Stage (for VM-based environments)
- Job Status
- Job ID
- Start Time
- Last Update On time
Using this data can help you to troubleshoot failed jobs or even understand how the jobs were profiled and other pertinent information that can help you to manage your profiled assets.
In VM-based environments, profiler job runs ins the following phases:
- Scheduler Service - The part of Profiler Admin which queues the profiler requests.
- Livy - This service is managed by YARN and where the actual asset profiling takes place.
- Metrics Service - Reads the profiled data files and publishes them.
In case of Ranger Audit profiling, there could be a “NA” status for the total number of assets profiled. It indicates that the auditing that happens is dependent on the Ranger policies. In other words, the Ranger policies are actually profiled and not the assets.