Using Hue
Get started using Hue by analyzing and visualizing your data with Impala, a high-speed, low-latency SQL query engine.
To try Hue without having an account, try running sample queries on http://demo.gethue.com/.
- Download and unzip one year of bike trips from the Bay Area Bike Share program. This file is about 80 MB in size.
-
Create a table from the
~/babs_open_data_year_1/201402_babs_open_data/201402_trip_data.csvfile found in the unzippedbabs_open_data_year_1.zipfile:- In the Cloudera Manager Admin Console, select Hue > WebUI > Hue Load Balanced to launch Hue.
-
In the left panel of Hue, make sure the default database is
selected, and click the plus sign to create a table:

If the default database is not selected, click the "less than" icon that
is next to the database icon in the left panel. This enables you
to select the default database.
- In the center panel Importer UI, set Type to File.
-
Drag the
201402_trip_data.csvfile to the Path field: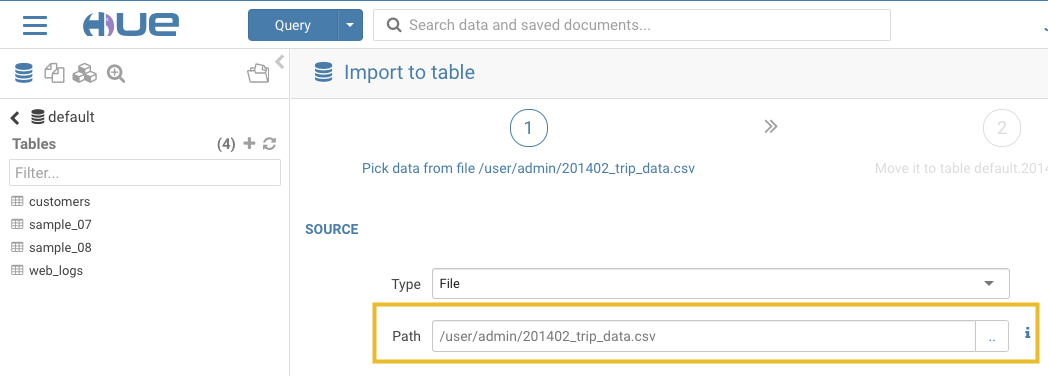
-
Set the formats as follows:
- Field Separator = Comma (,)
- Record Separator = New line
- Quote Character = Double Quote
Then click Next at the bottom of the page.
- Set the properties Format = Text.
-
Edit the FIELDS as follows:
- Rename Bike # to Bike ID
- Change the data type of ZipCode to string.
- Remove all of the spaces in the Name fields.
Then click Submit at the bottom of the page.
-
Click Query at the top of the page and select Editor > Hive to open the Hive editor and then create a query.
- Enter the following query into the editor window:
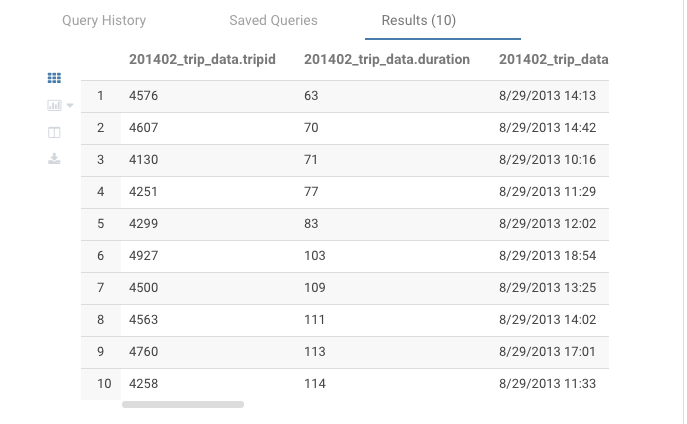
SELECT * FROM default.201402_trip_data LIMIT 10; -
Click the execute icon
 to run the query. The following rows are
returned:
- Enter the following query into the editor window:
-
Click Query at the top of the page and select Editor > Impala to open the Impala SQL editor and then create a query.
-
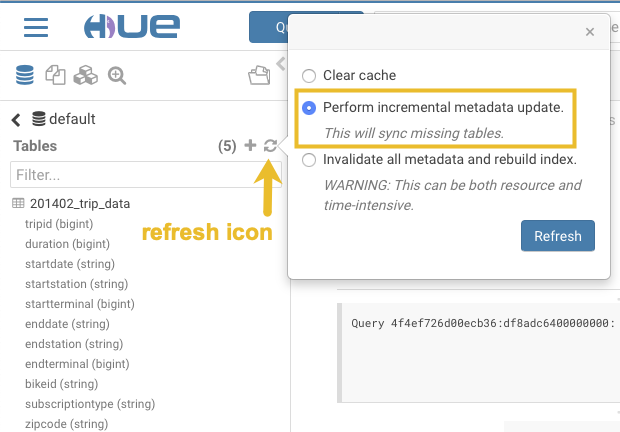
In the left panel, click the refresh icon and select Perform incremental metadata update to make the new table visible to Impala:
-
Enter the following query into the editor window:
select 'startstation', 'endstation', count(*) as trips from default.'201402_trip_data' group by 'startstation', 'endstation' order by trips desc; -
Click the down arrow just under the execution icon and select Format:
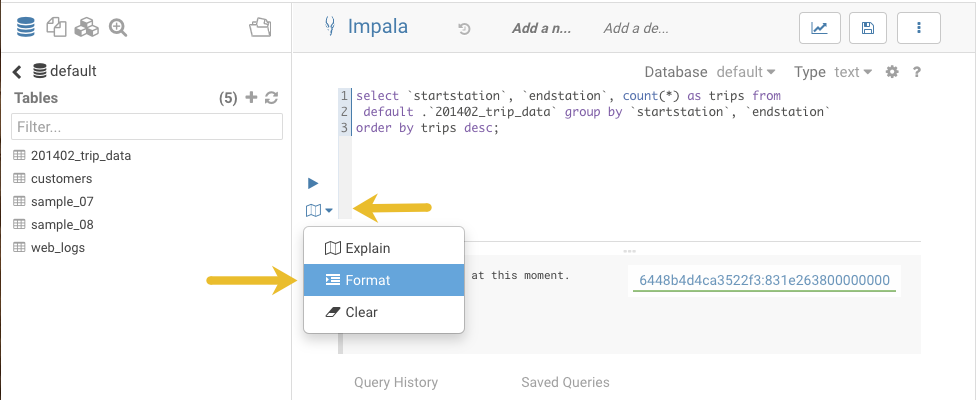
This reformats the query:

- Click the save icon
 , enter a query name, and click
Save.
 - Click the execute icon
 to run the query.
-
-
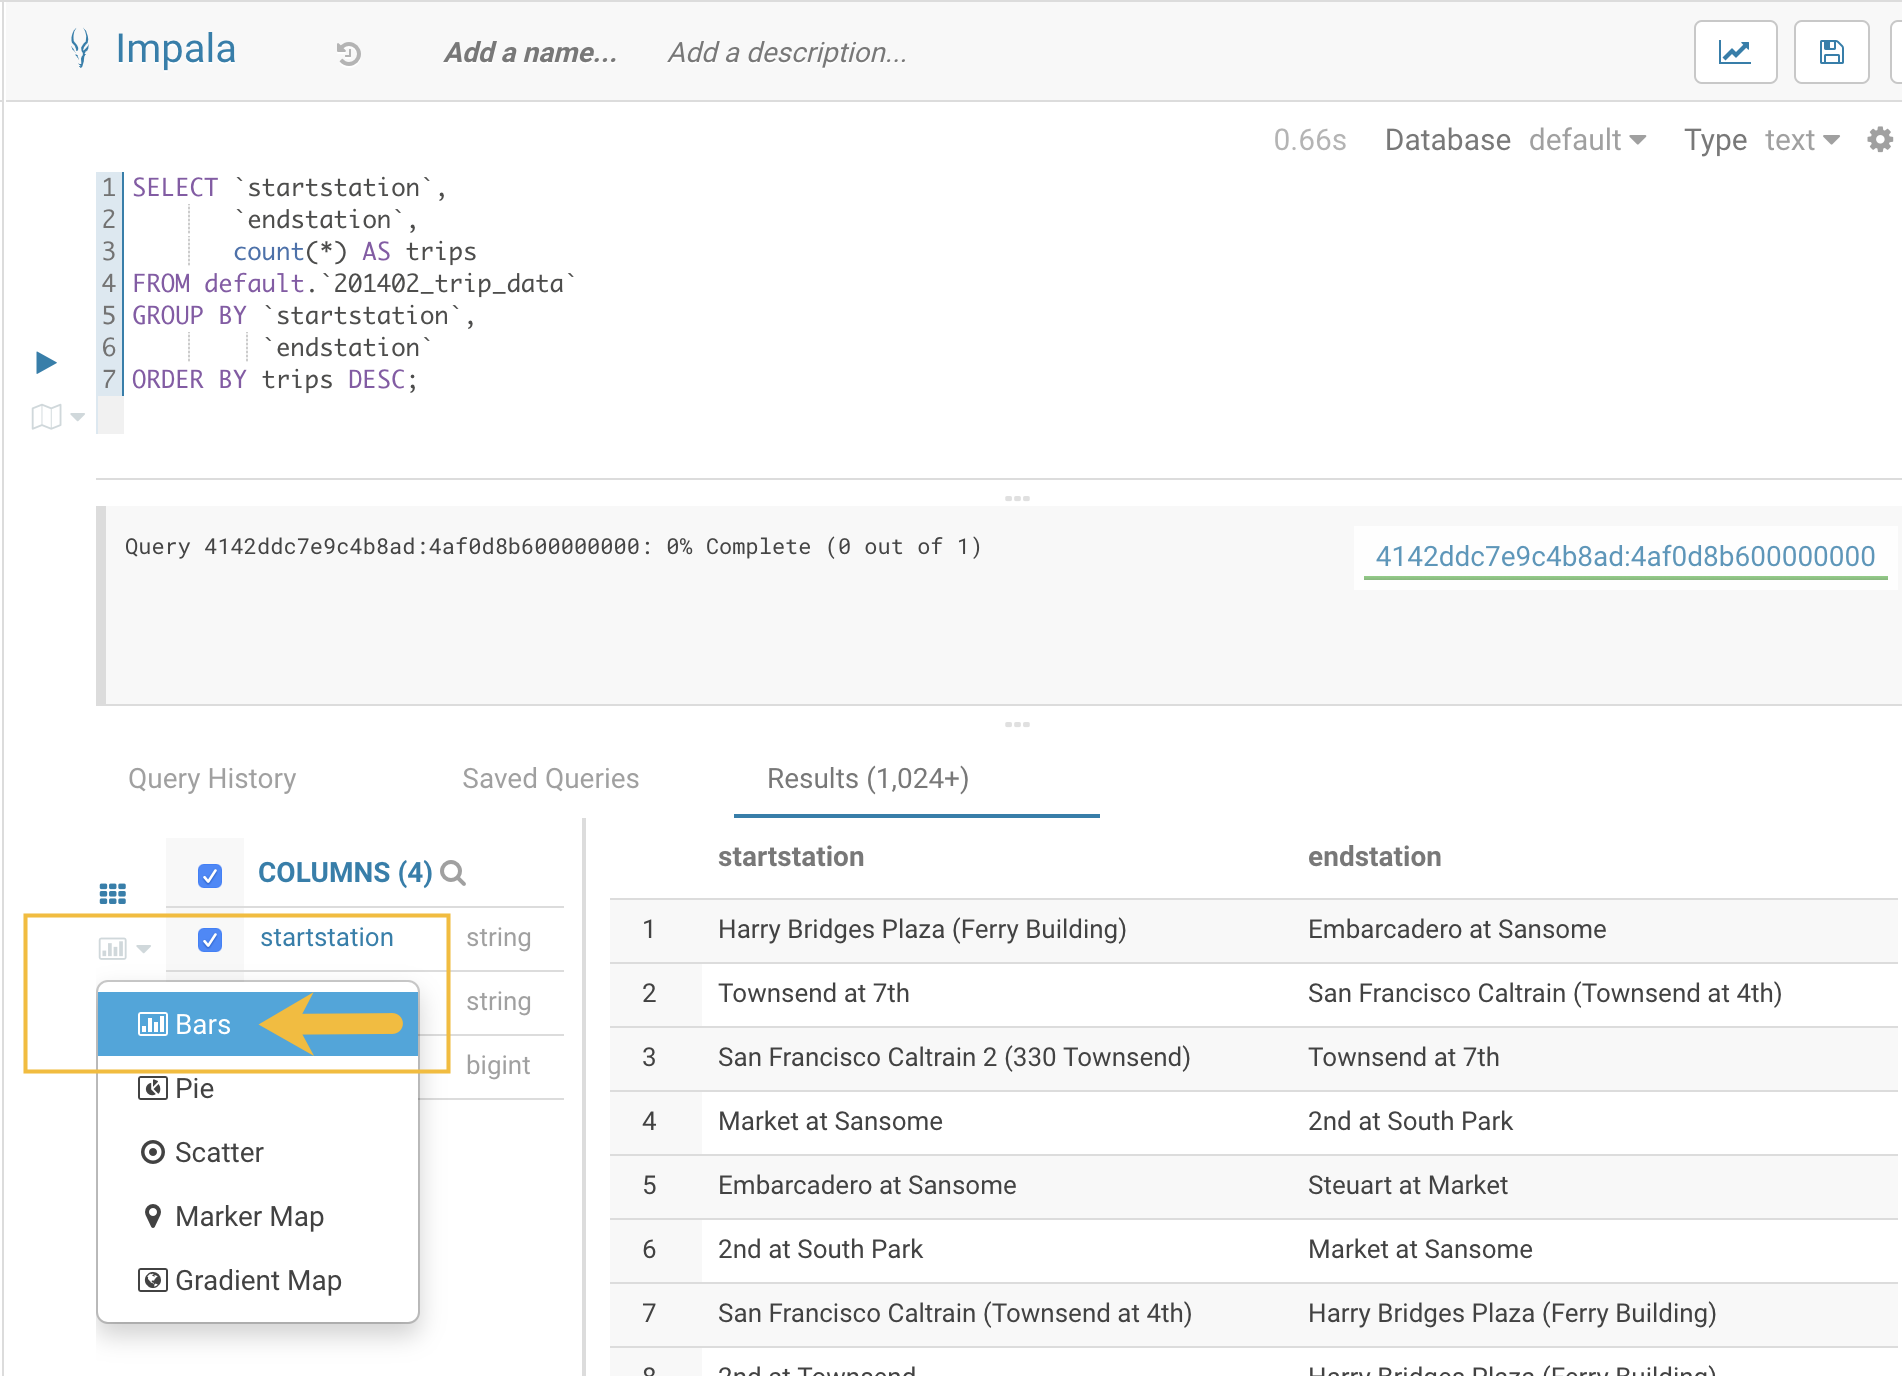
Create a bar chart that is based on the query results:
-
Click the chart icon
 and then select Bars.
-
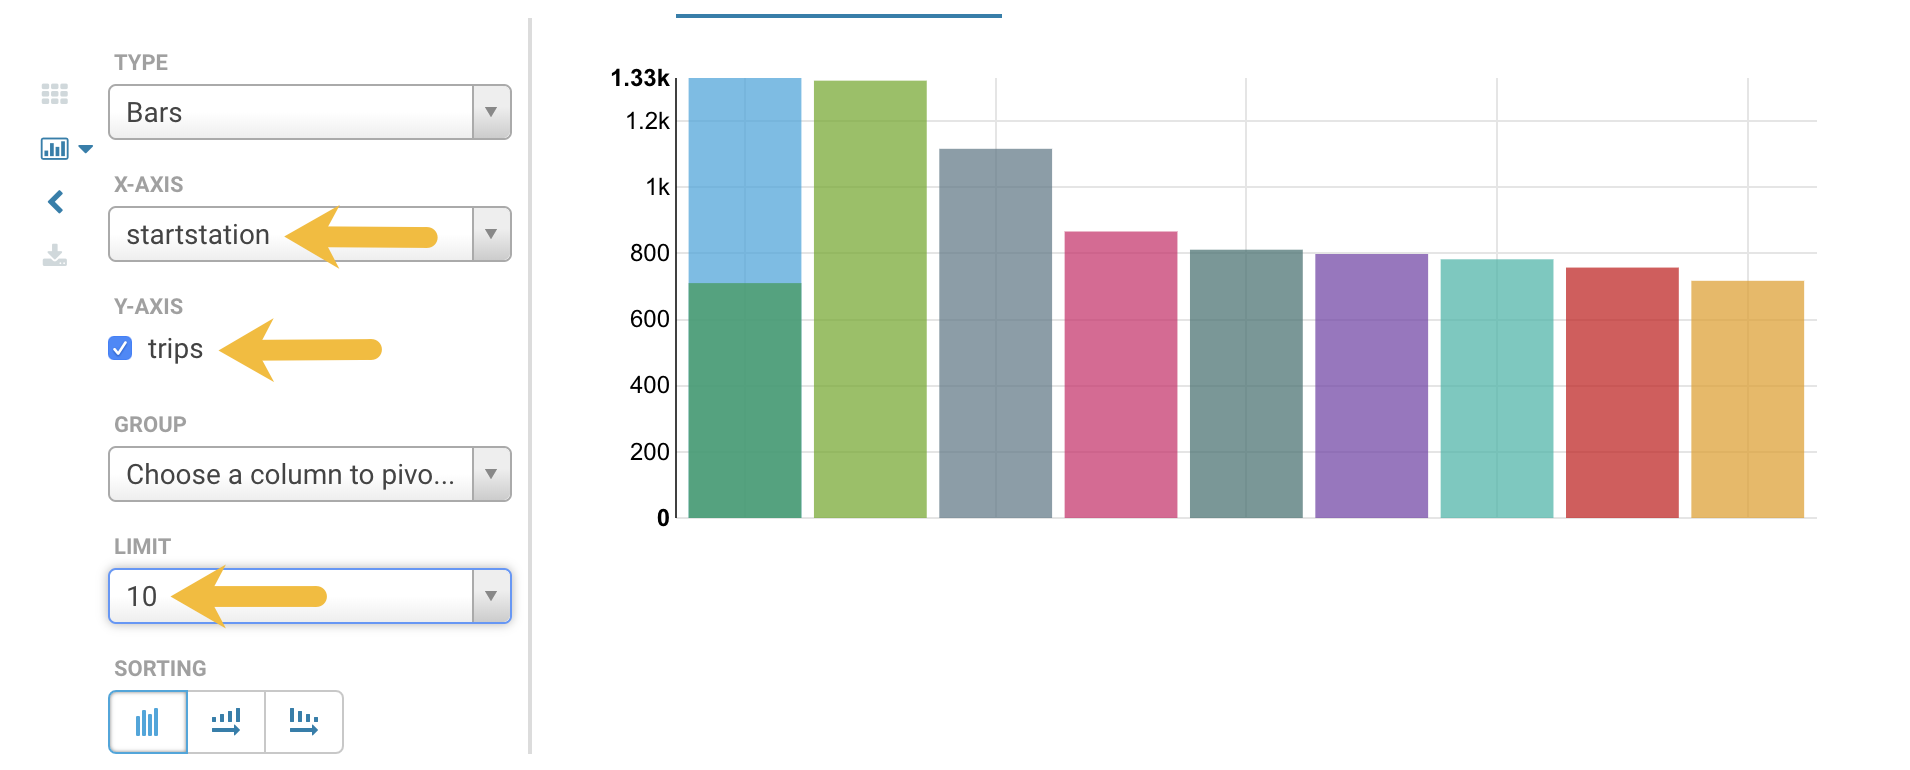
Set the bar chart elements as follows:
- X-AXIS = startstation
- Y-AXIS = trips
- LIMIT = 10
-
-
Create a pie chart by clicking the chart icon again
 and then select
Pie.
-
Download the query results by clicking the download icon
 and selecting in what format you want to
download, copy, or export the results.


