Monitoring Cloudera Data Warehouse service resources with Grafana
dashboards
Grafana is visualization and analytics software that enables the development of
dashboards to monitor metrics data. You can access pre-built Grafana dashboards to monitor
Virtual Warehouses and your compute cluster in Cloudera Data Warehouse.
You connect to prebuilt dashboards to view metrics of Cloudera Data Warehouse
operations. Cloudera provides prebuilt Grafana
dashboards for Hive, Impala, and Hue dashboards of metrics data, charts, and other
visuals.
Using Grafana, Cloudera metrics are centralized in a single
spot, stored in the Prometheus database, and monitored by Prometheus. Your workload databases
are not involved in any way. You can immediately view the following pre-built dashboards:
Hive dashboards
The Hive dashboards cover the following operations of the Hive SQL engine in Cloudera Data Warehouse:
Auto-scaling
Hive metastore
HiveServer
The Hive service itself (Hive-Home)
LLAP
Impala dashboards
The Impala dashboards include the following operations of the Impala SQL engine in Cloudera Data Warehouse:
Catalog server
Coordinator
Executor
Statestore
The Impala service itself
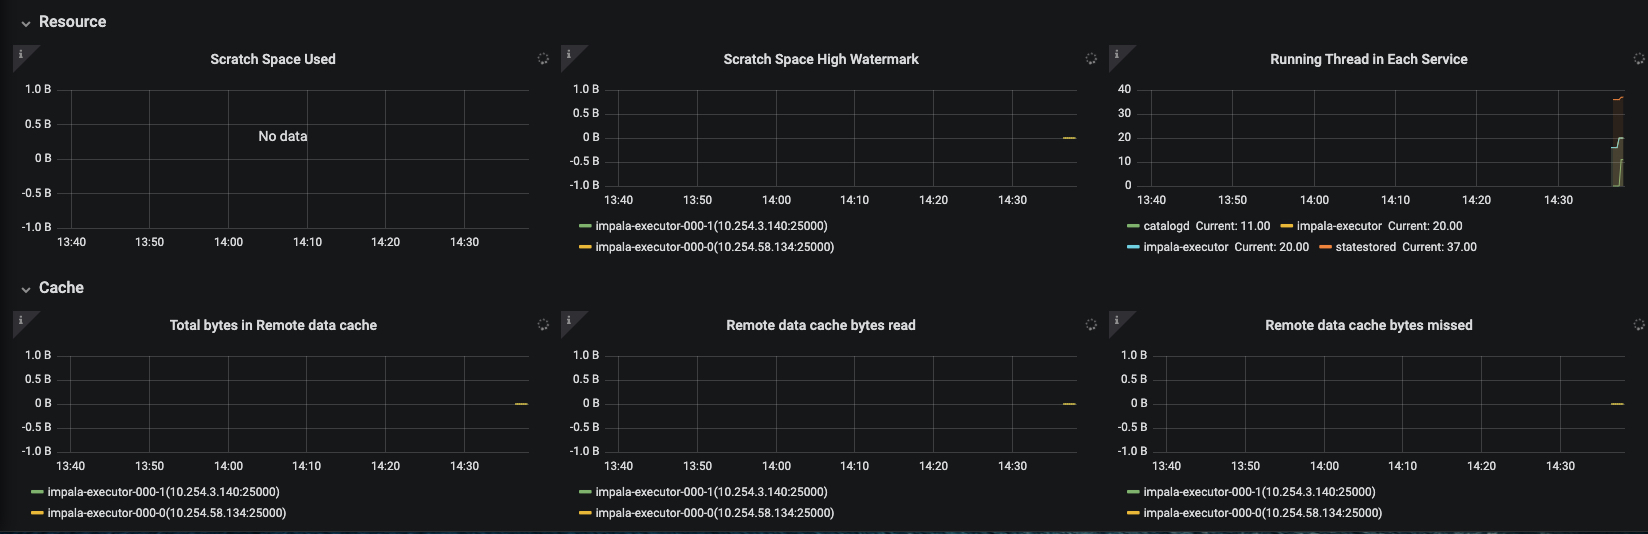
The following screenshot shows the available scratch and cache disk utilization graphs for
the Impala Virtual Warehouse:
You can view dashboard metrics for different time periods by selecting the period of interest
from the time range dropdown in the horizontal navigation.
On the Cloudera Embedded Container Service platform, you can view the CPU, memory, network
usage, and disk input-output for each Cloudera Data Warehouse node using the
[***ENVIRONMENT-NAME***]-Nodes option. You can also expand the individual dashboards to see
more details, as described in the following table: