Cloudera AI Quota Management dashboard
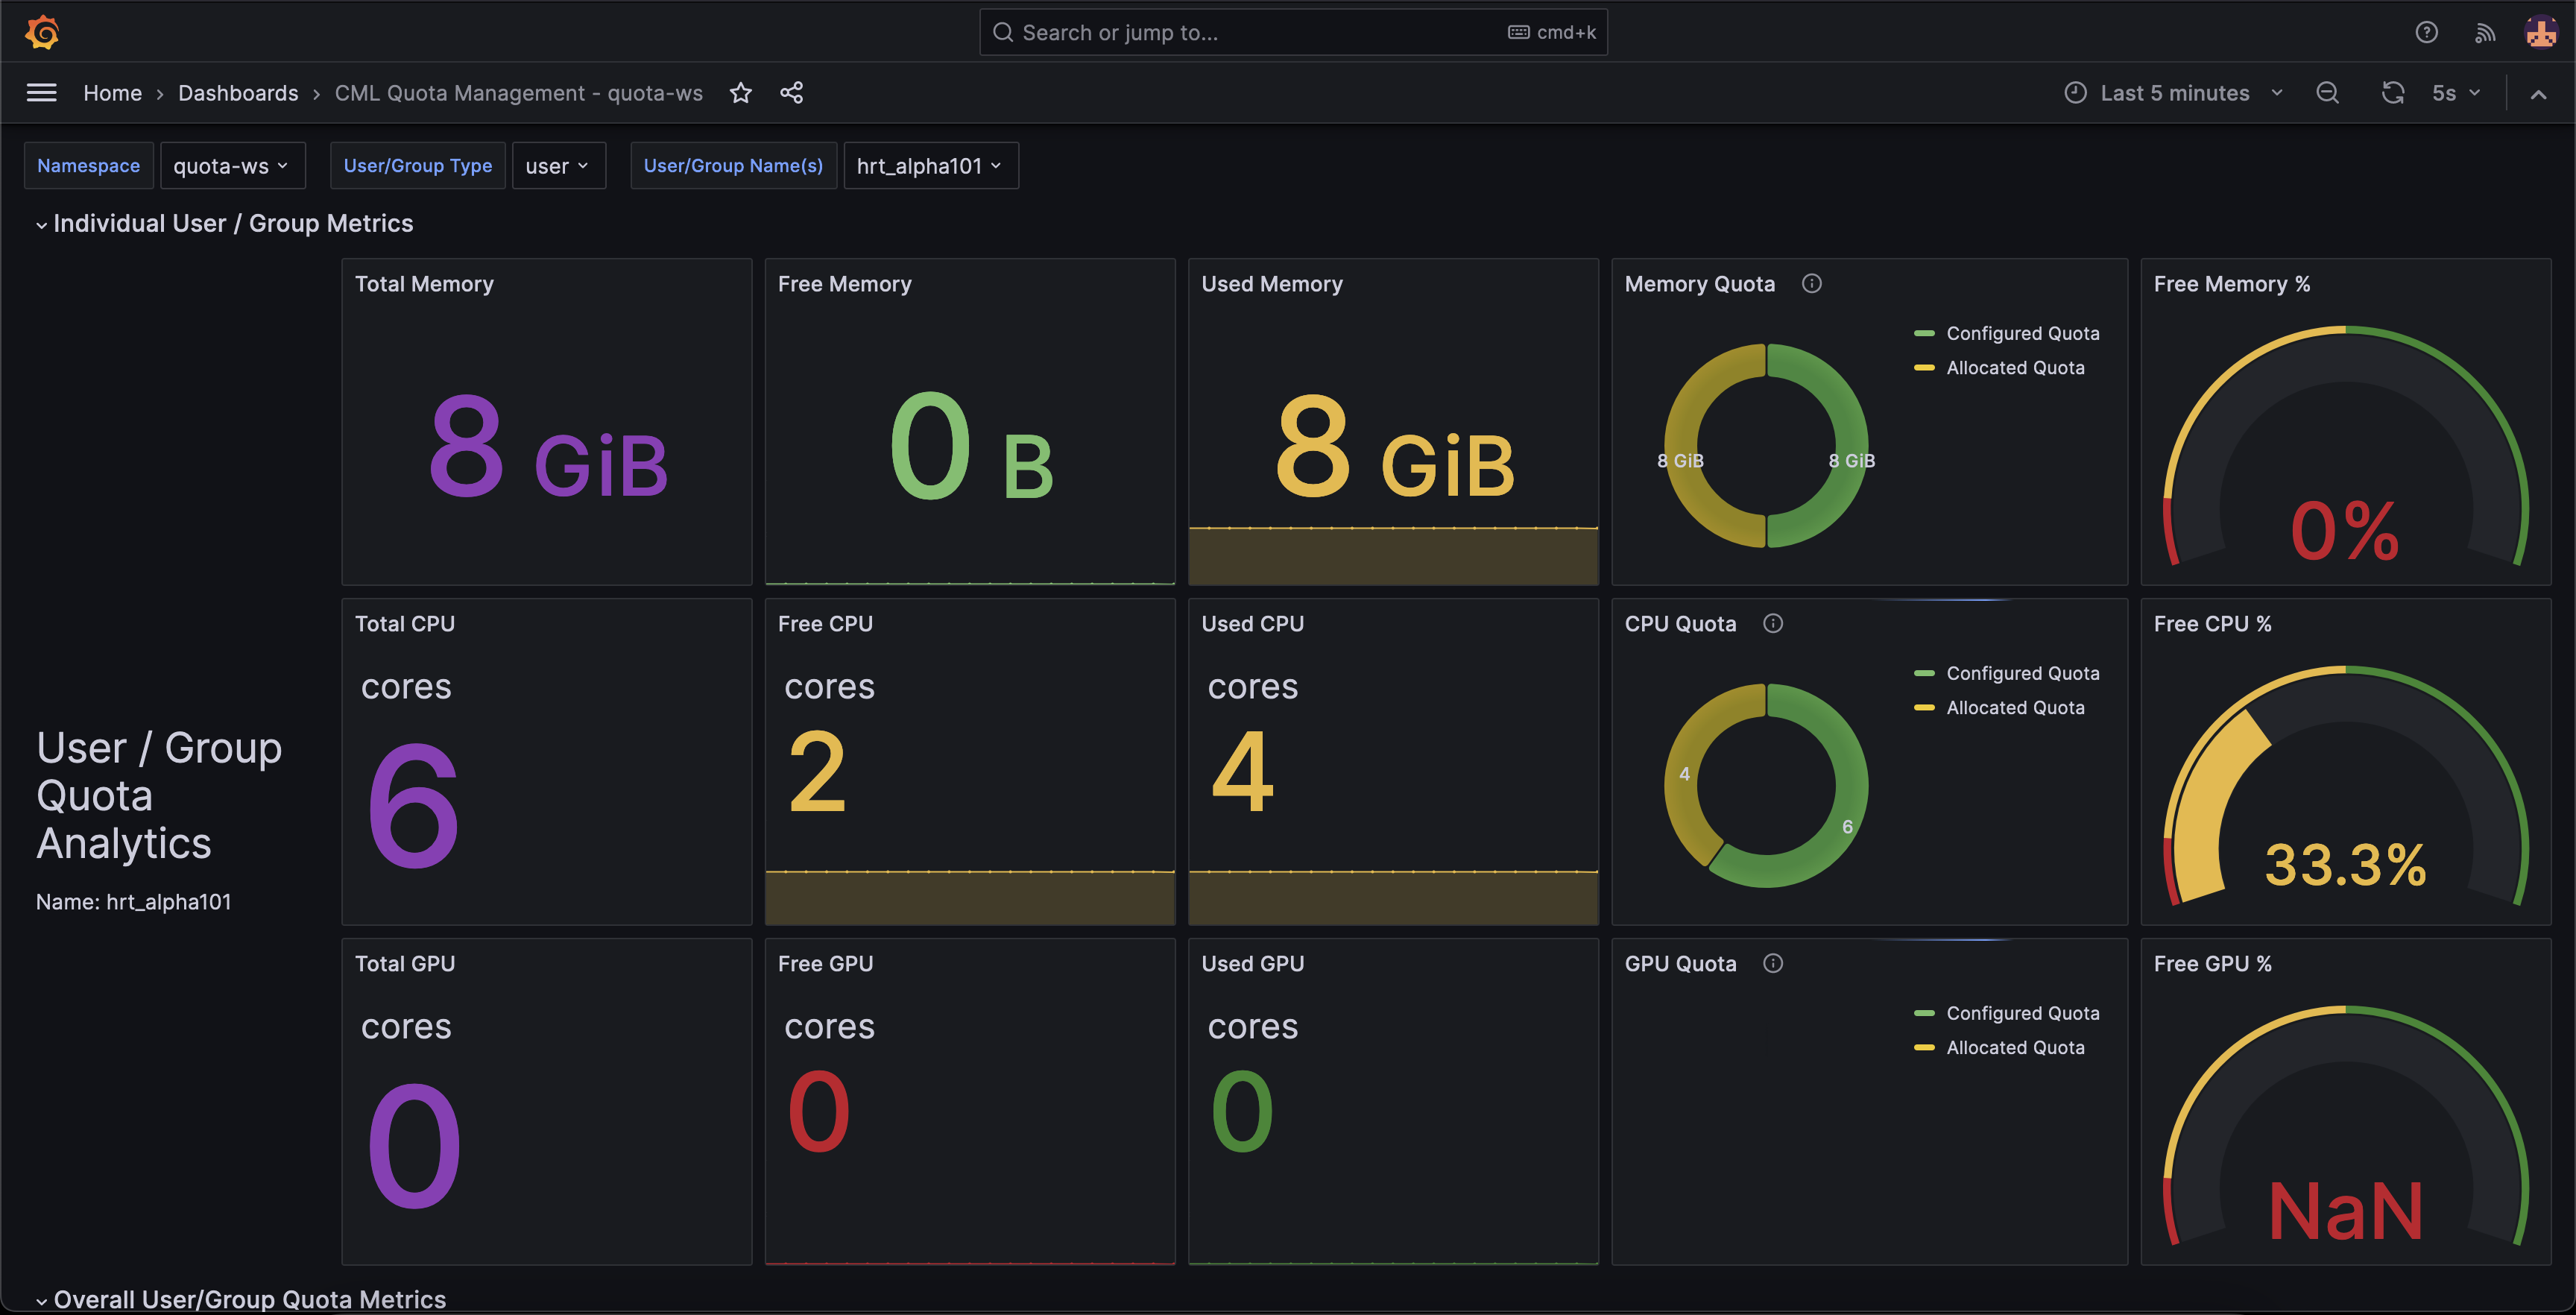
The Cloudera AI Quota Management Dashboard provides an overview of resource quota allocation and utilization of the users or groups within the Cloudera AI environment. Users can filter the dashboard by selecting the namespace for the Cloudera AI Workbench, choosing the user or group type, and specifying the user or group name.
Individual user or group metrics
- Total Memory, CPU, and GPU: It displays the total configured resources.
- Free Memory, CPU, and GPU: It shows the current available resources for the user or group.
- Used Memory, CPU, and GPU: It indicates the current utilized resources.
- Memory, CPU, and GPU Quota: It presents pie charts comparing configured versus allocated quotas.
- Free Memory %, CPU %, and GPU %: It displays the percentage of available free resources in gauge charts.
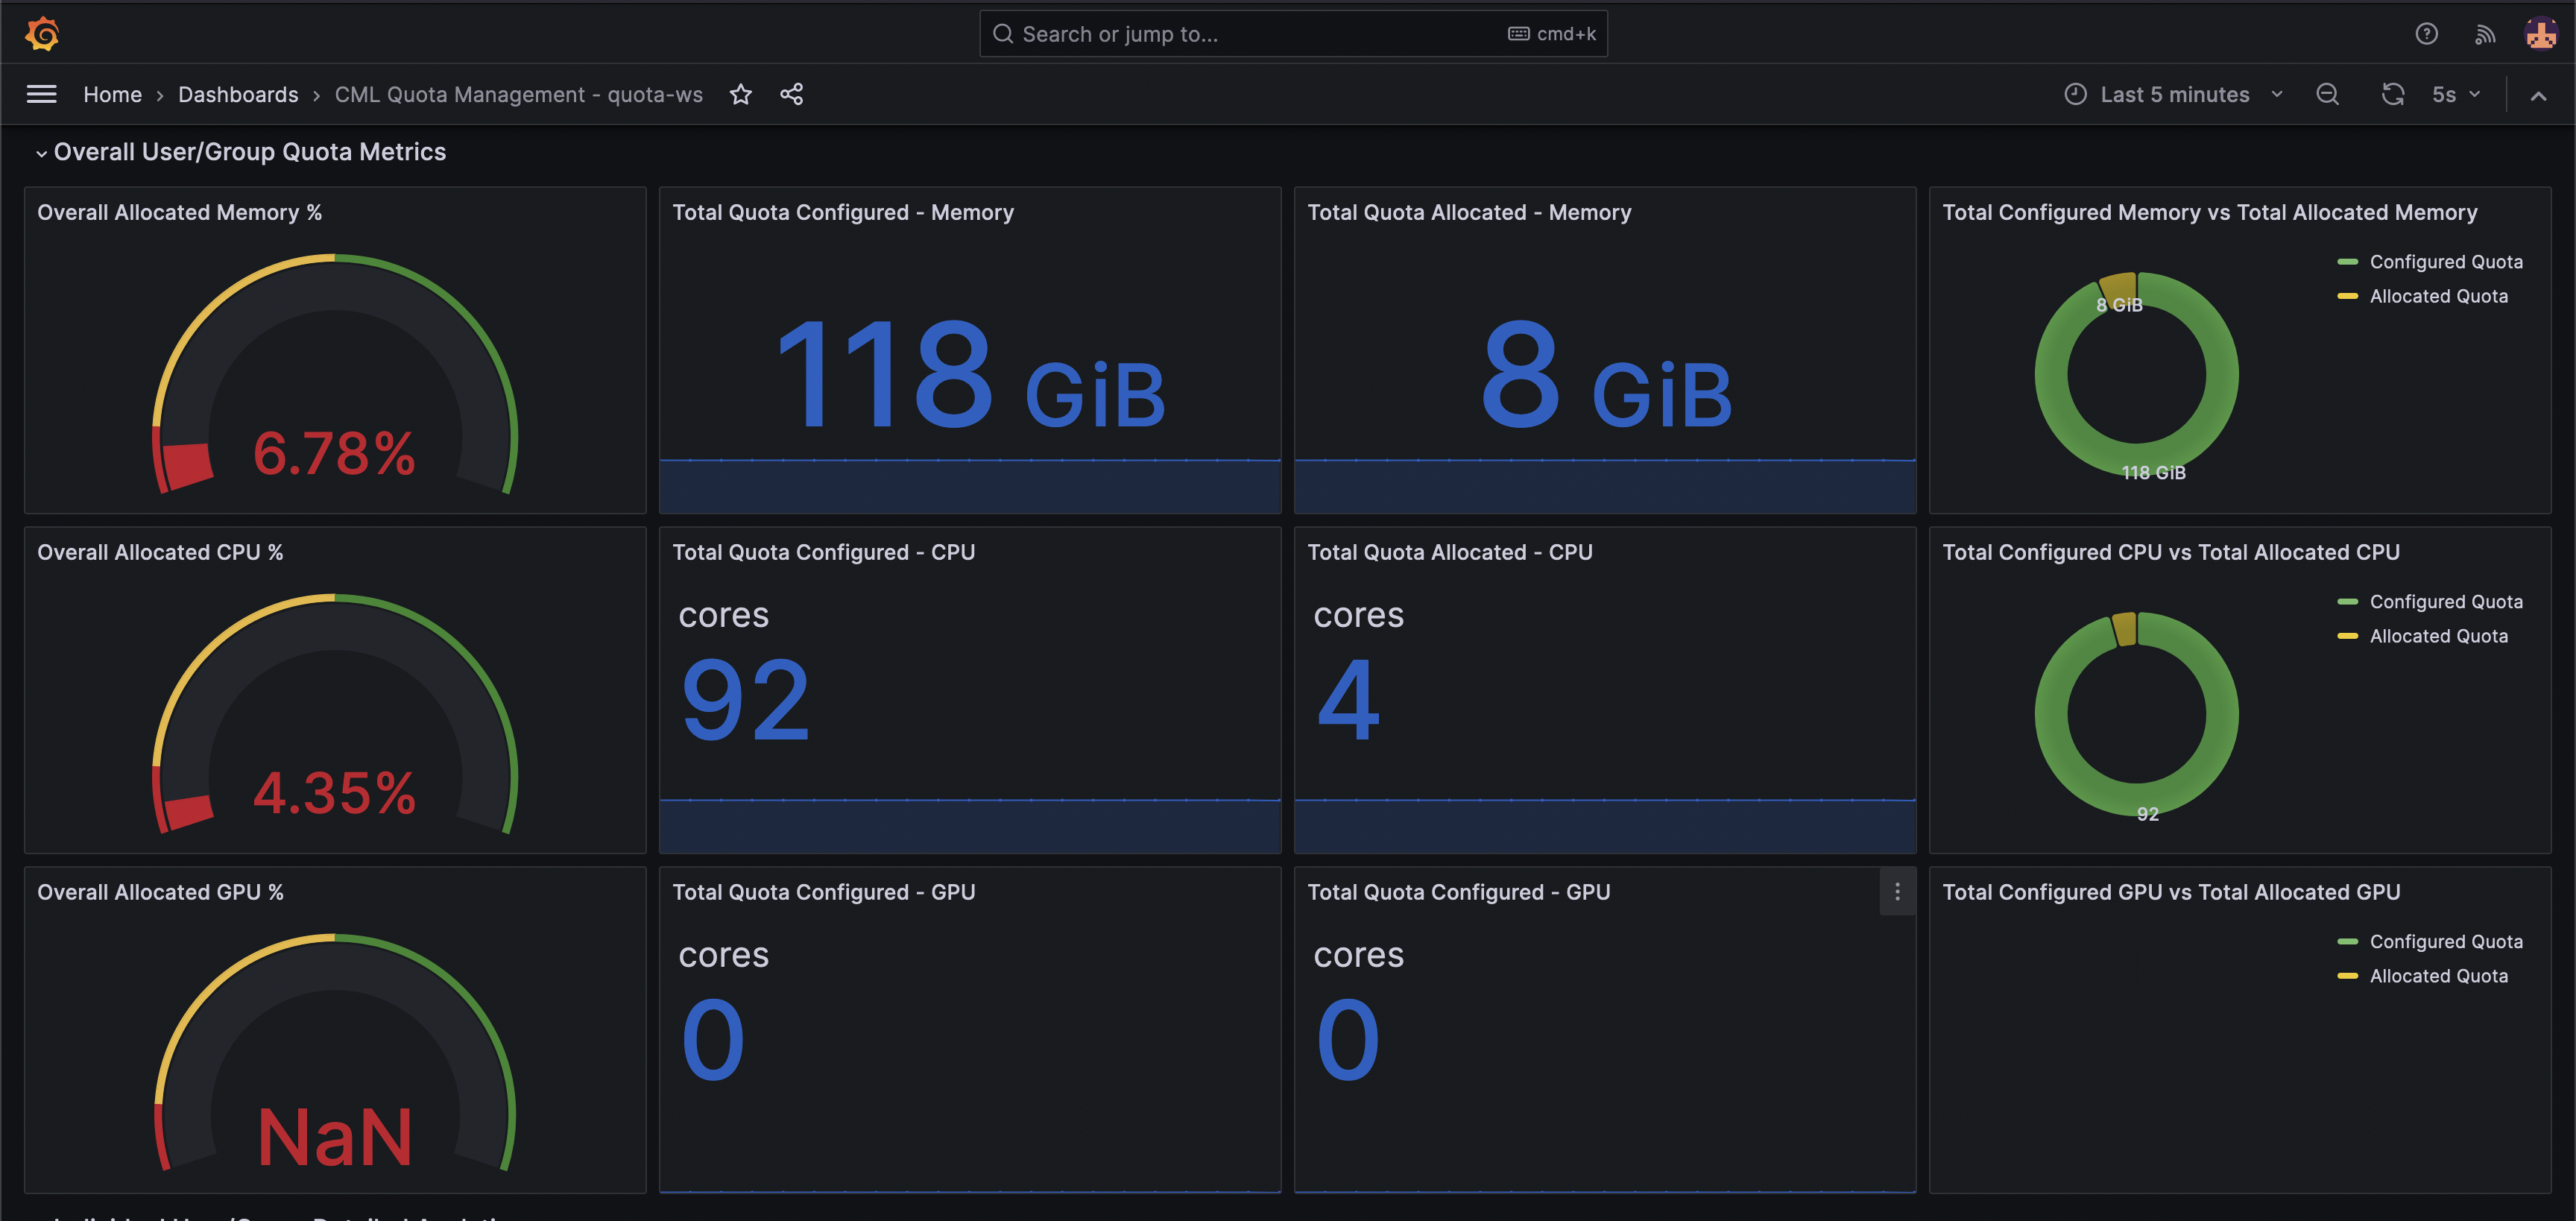
Overall user or group metrics
- Overall Allocated Memory %, CPU %, and GPU %: It shows the total allocated resources as a percentage of all users/groups.
- Total Quota Configured - Memory, CPU, and GPU: It displays the total configured resources of all users/groups.
- Total Quota Allocated - Memory, CPU, and GPU: It indicates the total allocated resources of all users/groups.
- Total Configured Memory vs Total Allocated Memory, CPU vs CPU, GPU vs GPU: It presents pie charts comparing the total configured resources versus the total allocated resources.
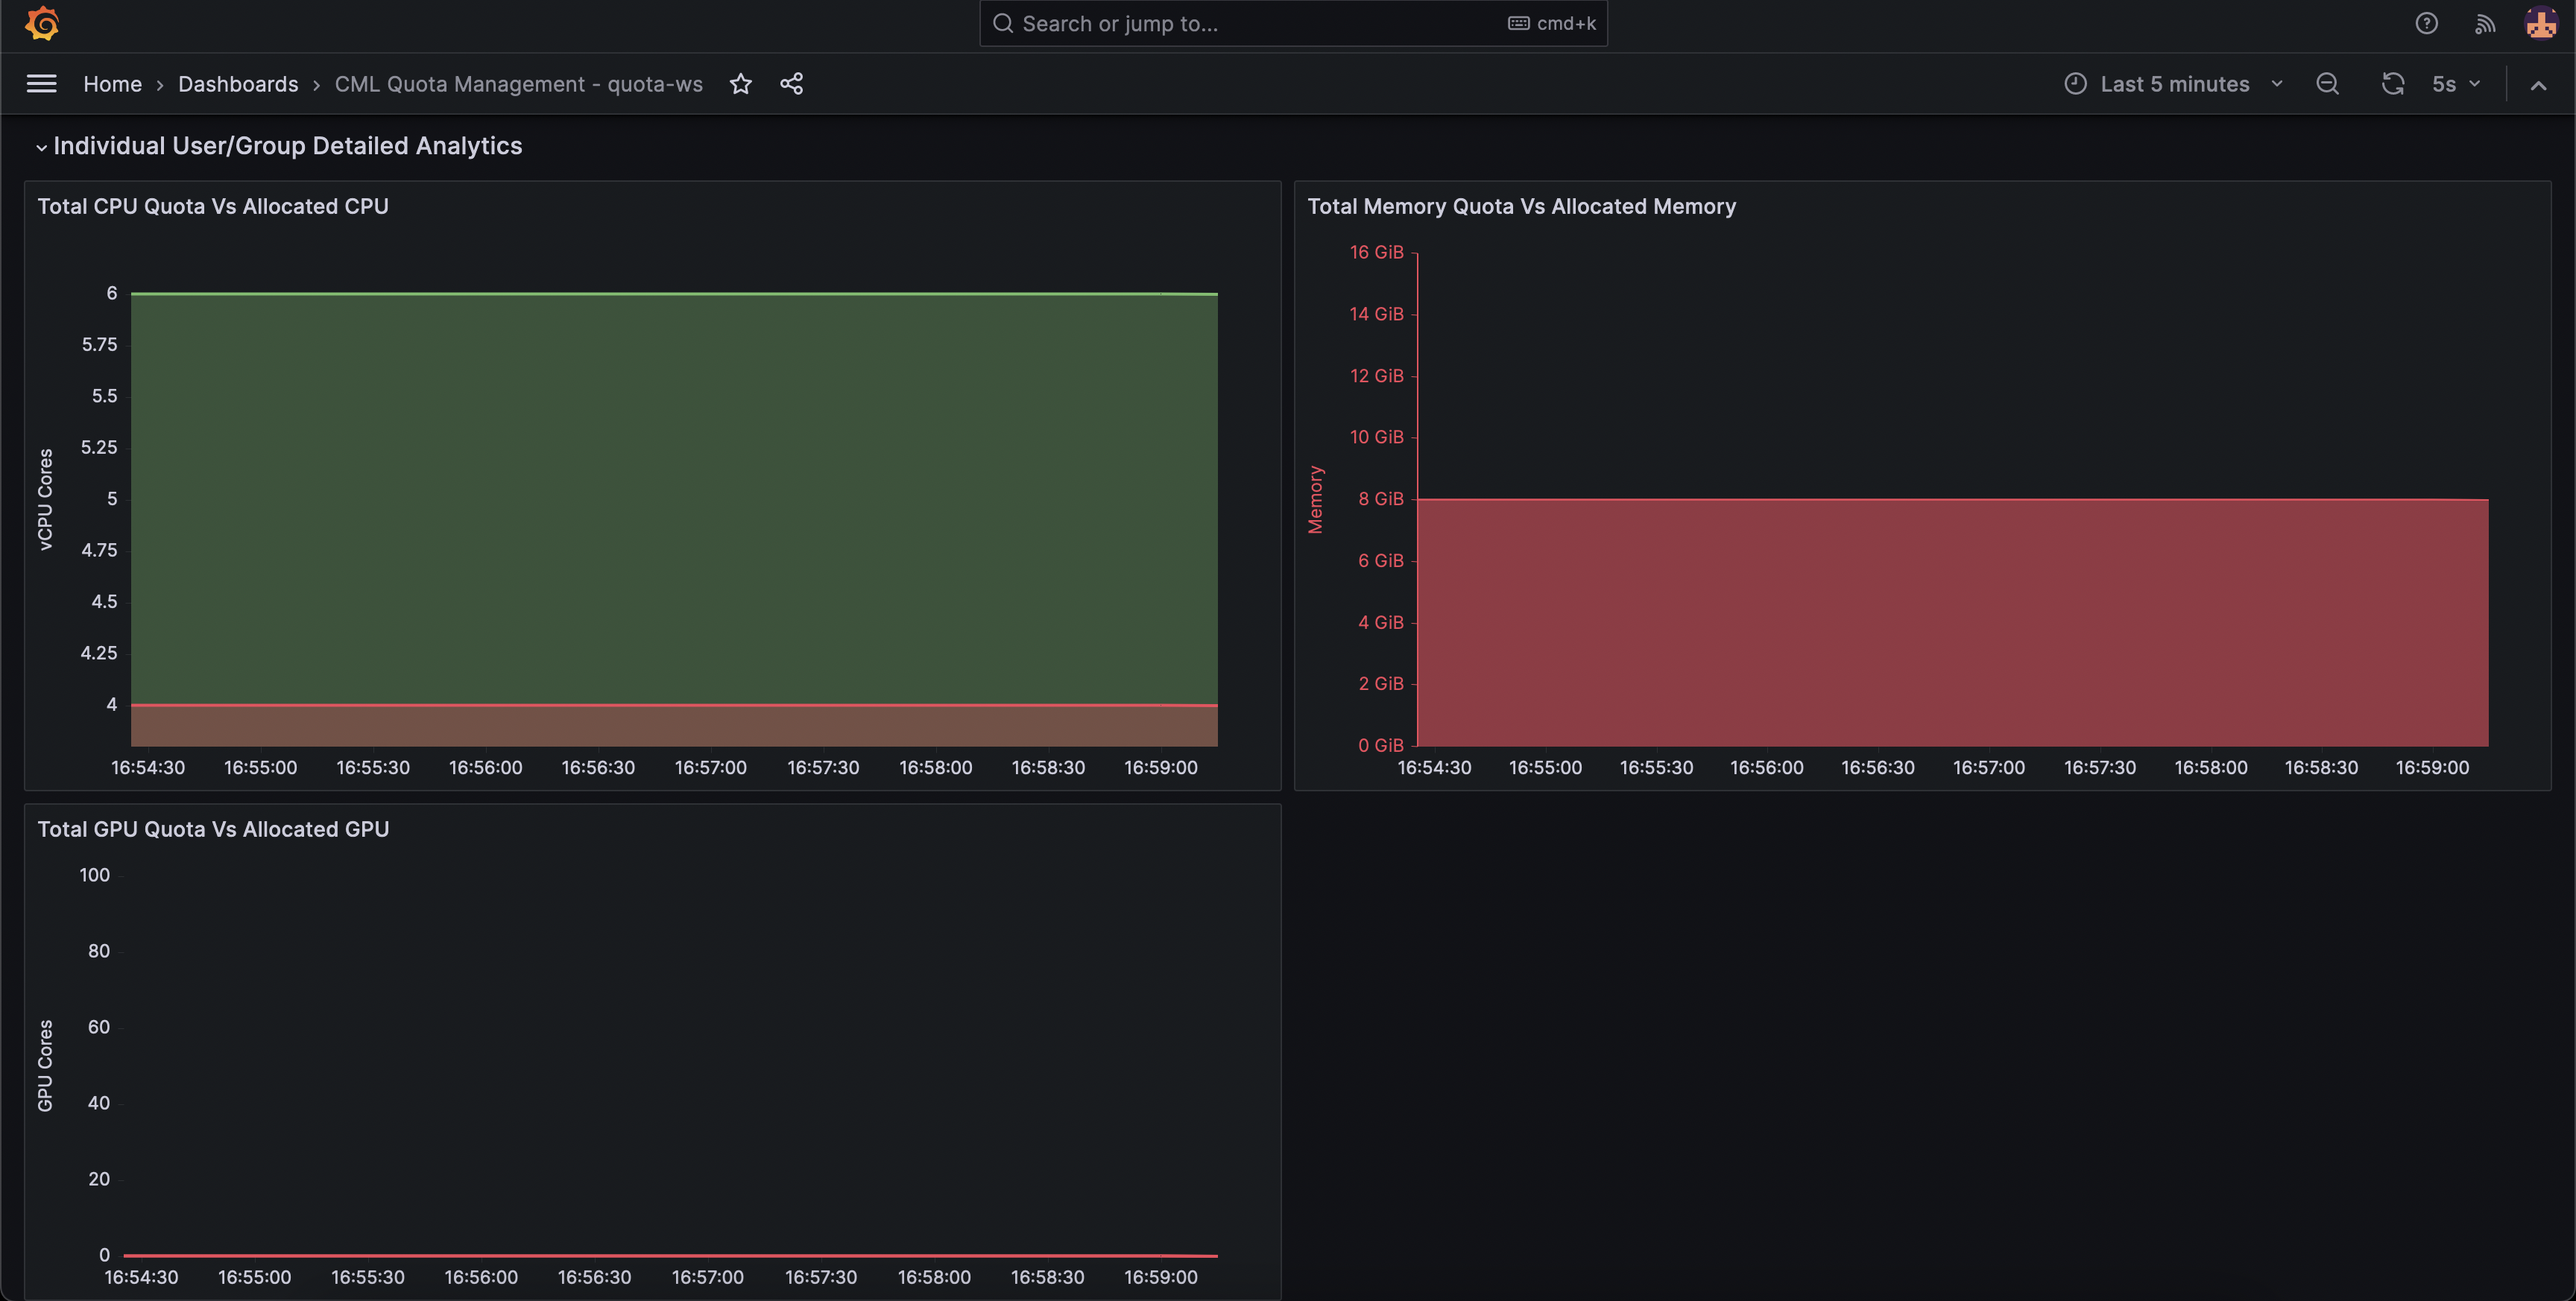
Individual user or group detailed analytics
The examples showcase the configured Memory, CPU, and GPU resources compared to the allocated resources for the specified user or group.