Specifying a time range

Enable a more in-depth analysis about your costs and workloads by displaying current or historical data for a specific time period.

Describes how to change the currently displayed time period from the time-range list, which appears on the Cluster Summary, Engine Summary, and Workload Summary pages.
By default, Cloudera Observability displays workload data for the last 24 hours. If there is no data available during that time, Cloudera Observability displays the nearest date range that is available.

The following steps describe, with examples, how to change the time period from the Cluster Summary page.

  1. Verify that you are logged in to the Cloudera Observability web UI and that you selected an environment from the Analytics Environments page.
    1. In a supported browser, log into the Cloudera Data Platform (CDP).
      The CDP web interface landing page opens.
    2. From the Your Enterprise Data Cloud landing page, select the Observability tile.
      The Cloudera Observability landing page opens to the main navigation panel.
    3. From the Cloudera Observability Environments page, select the environment required for analysis.

      The Environment navigation panel opens.

  2. Depending on the environment selected, verify that the Cluster Summary page is displayed for the environment's cluster required for analysis.
    To display the Cluster Summary page for a Data Lake, Database Catalog, Data Engineering, and Data Hub environment type, do one of the following:
    • From the Environment panel, expand the service's category and depending on the service, locate and select the Data Hub's cluster, the Data Engineering's Virtual Cluster, or the Data Warehouse's Virtual Warehouse that is required for analysis.
    • In the Data Services table, drill-down through the service links to locate and select the Data Hub's cluster, the Data Engineering's Virtual Cluster, or the Data Warehouse's Virtual Warehouse that is required for analysis.
  3. From the time-range list, do one of the following:
    • For a predefined period, select one of the default periods of time that meets your requirements.
    • For an exact date and time range, select Customize and then either, enter the date and time range using the YYYY/MM/DD HH:MM:SS format for the beginning and the ending time period, or in the calendar element, select the beginning and ending time period.
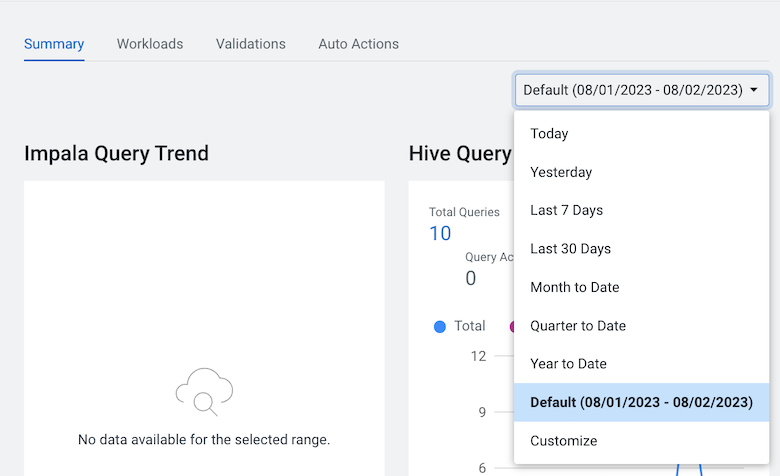
    The following image shows an example of the time-range list on a Cluster Summary or Engine Summary page:
    Figure 1. Analytics time-range list


  4. Click Ok, which clears any existing workload data from the chart and table components and updates your workload data for the chosen time period.
All charts and tables in Cloudera Observability are updated to reflect the workload data for the chosen time period.