Defining workload views manually
Steps for manually defining your workload views.
-
Verify that you are logged in to the Cloudera Observability web UI.
-
In a supported browser, log into the Cloudera Data Platform.
The CDP Public Cloud web interface landing page opens.
-
From the Your Enterprise Data Cloud landing
page, select the Observability tile.
The Cloudera Observability landing page opens.
-
In a supported browser, log into the Cloudera Data Platform.
-
In the Clusters page, select any cluster.
The Cluster Summary page opens.
- From the Navigation panel, select Workloads.
-
In the Workloads page, click Manual:
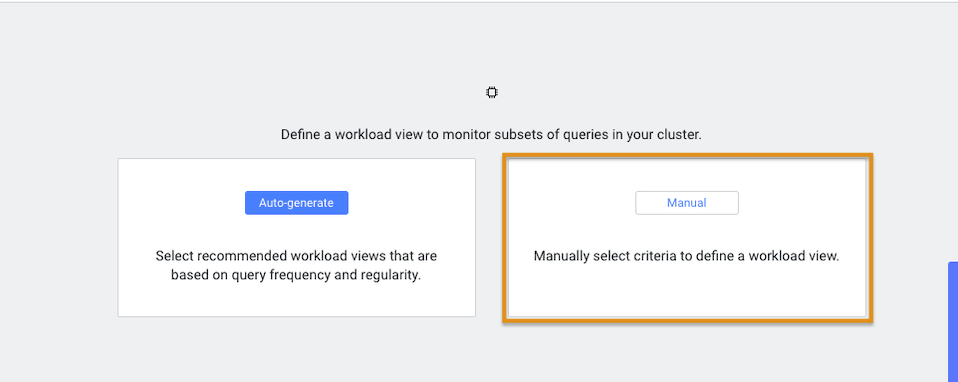
The Define Workload View widget opens, where you define a set of criteria that enables you to analyze a specific set of queries.For example, as shown in the image below, you can list the total amount of failed queries, as a percentage, from a specific engine that are subject to a two second SLA.Where, as defined by the criteria condition, Cloudera Observability will monitor all query jobs from the Impala engine. When the total query execution time exceeds 2 seconds, as defined by the SLA condition, for 90 percent of these queries, as defined by the Warning Threshold, the workload is flagged with a failed state:
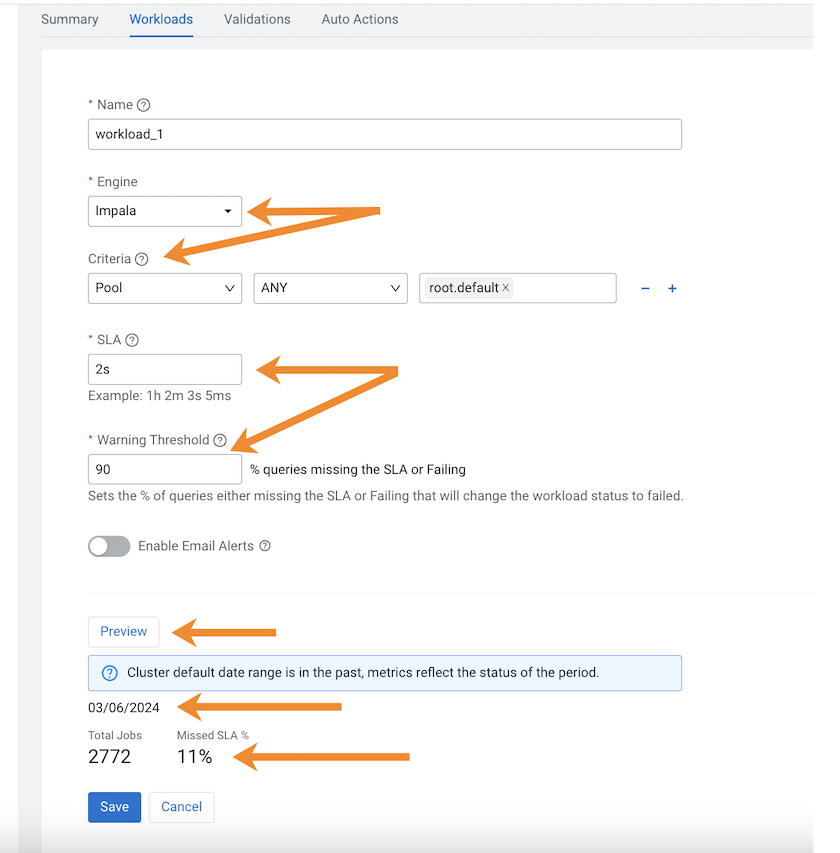
- (Optional) To display a summary of the queries matching your criteria, click Preview. The date range, the number of queries that match the criteria, and the number of queries that missed the SLA condition are displayed.
-
Click Save.
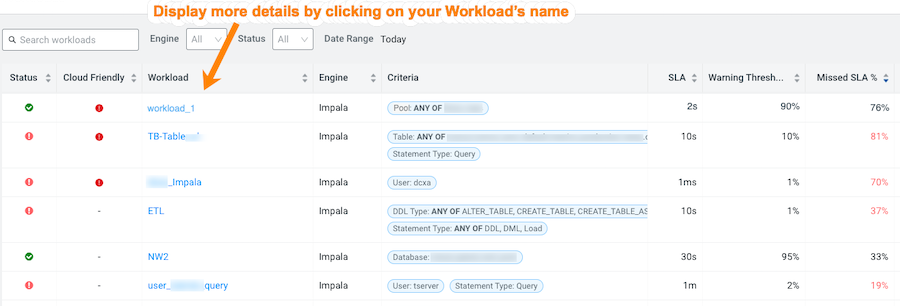
The Workloads page opens and your workload view appears in the Workload column.
-
(Optional) To view more information about the workloads using the view's
formula, open the Summary page by clicking the name of the workload view in the
Workload column, which displays the view's details
as chart widgets that you can use to further analyze the results.
The following examples display how this group of queries are meeting the Workload view's SLA in the Trend chart, where:
- The Count tab displays the number of executing
queries, either By Status or By
Statement Type. To view further details, click the
Total Queries, the Failed
Queries, or the Query Active Time
value.
- The Concurrency tab (which is not available for
CDP), displays the number of queries executing concurrently. In the following example, the maximum concurrency for this view is 328. This indicates that for the queries monitored by this view, 328 queries accessed the same data at the same time during the specified time period. The graph view displays how the concurrency fluctuates over the date range specified for the workload view.
- The Count tab displays the number of executing
queries, either By Status or By
Statement Type. To view further details, click the
Total Queries, the Failed
Queries, or the Query Active Time
value.