Learn how to use the Validations predictive alerting tool feature in Cloudera Observability that displays details about the issue, it's severity level, the
affected hosts, and the corrective actions you should consider to resolve the
problem.
Describes where to view the Validations alerts in Cloudera Observability that help
you fix problems within your environment's cluster and engines.
Verify that you are logged in to the Cloudera Observability web UI and that you
selected an environment from the AnalyticsEnvironments page.
Log in to Cloudera in a supported
browser.
The Cloudera web interface landing
page opens.
From the Your Enterprise Data Cloud landing
page, select the Observability tile.
The Cloudera Observability landing page opens to the main navigation
panel.
From the Cloudera ObservabilityEnvironments page, select the environment required
for analysis.
The Environment navigation panel opens.
To view all open validation alerts for your environment's cluster, do the
following:
Depending on the environment selected, verify that the
Validations page is displayed for the
environment's cluster required for analysis.
To display the
Validations tab, do one of the following:
For a Private Cloud Base and a
Classic Cluster environment type,
select the Validations tab in the
Cluster Summary page.
For a Data Hub environment type, expand its Data Lake
category in the Environment's panel, locate and select the
Data Hub cluster, and then select the
Validations tab in the
Cluster Summary page.
The Validations page opens, which displays the current alerts
for the cluster that requires attention.
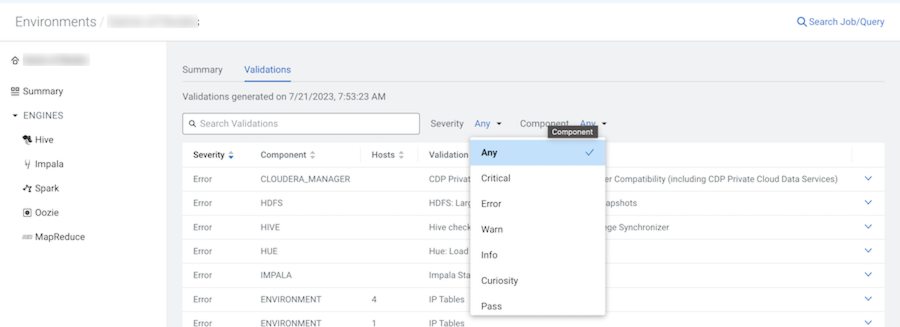
Optional: Sort your alerts from any column, such as by the number of hosts
affected, the severity level, and/or by the component that is
affected.
Optional: Filter the alerts displayed by doing one or more of the
following:
Select a severity alert level from the
Severity filter list, such as
Critical.
Select a specific component from the
Component list, such as HBASE,
HDFS, or HIVE.
Locate the alert of interest, expand and display the full details about
the alert, and then follow the recommended course of action to fix the
issue.
The following example, shows the Validations page and the Severity list for an
environments cluster.
To view the open validation alerts for an engine in the environment's cluster,
do the following:
Verify that the engine's Summary page is
displayed for the environment's cluster.
To display the engine's
Summary page, do one of the following:
For Private Cloud Base and
Classic Cluster environment type,
locate the cluster's ENGINES category and select a workload
engine of interest.
For a Data Hub environment type, expand its Data Lake
category in the Environment's panel, locate and select the
Data Hub cluster, and then from the ENGINES category,
select a workload engine of interest.
The engine's Summary page opens, which displays a series of
chart widgets that display metrics about the workload jobs run by
the selected engine.
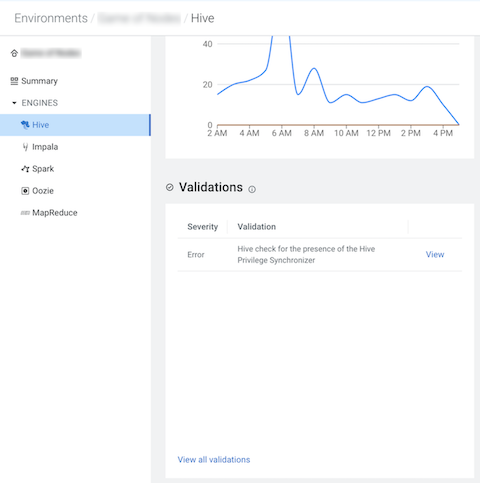
Scroll down and locate the Validations chart
widget, which displays the current alerts for the engine that requires
attention.
Locate the alert of interest and then display the full details about
the alert in a new dialog box, by clicking View.
Follow the recommended course of action that will help you fix the
issue.
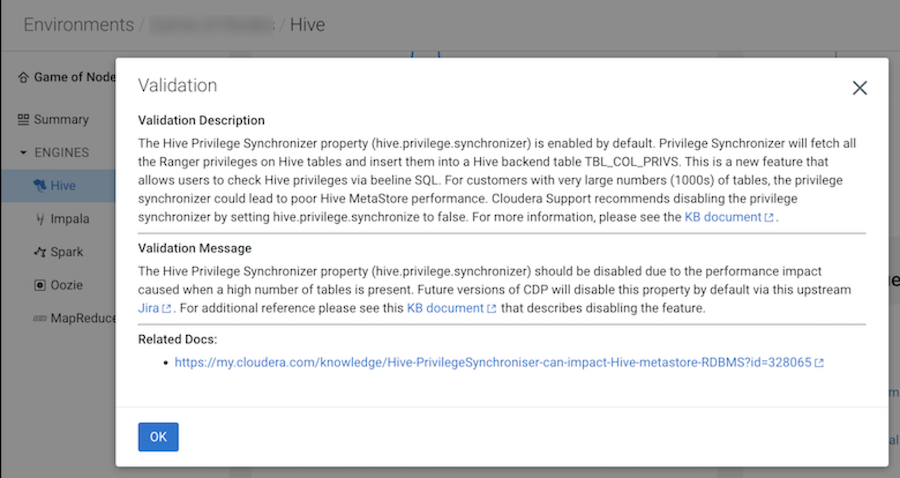
The following examples show the Validations chart
widget and an Error severity Validation alert for a Hive
engine, which indicates incorrect settings and configurations that require
attention. The Validation message explains why the Hive Privilege Synchronizer
property should be disabled and provides a link on how to disable.
To view the open validation alerts specifically for a Hive query, do the
following:
Verify that the environment's Cluster Summary
page is displayed for the Cloudera Observability environment.
To display the Cluster
Summary page, do one of the following:
For Private Cloud Base and
Classic Cluster environment type,
verify that the Cluster Summary title is
displayed in the browser tab.
For a Data Hub environment type, expand its Data Lake
category in the Environment's panel and then locate and select
the Data Hub cluster of interest.
The Summary page opens, which displays a series of performance
trends and metric chart widgets about the processed jobs and
queries.
From the Hive Query Trend chart widget, click
its Total Queries value.
From the Job column in the Queries page, locate
and click the query of interest.
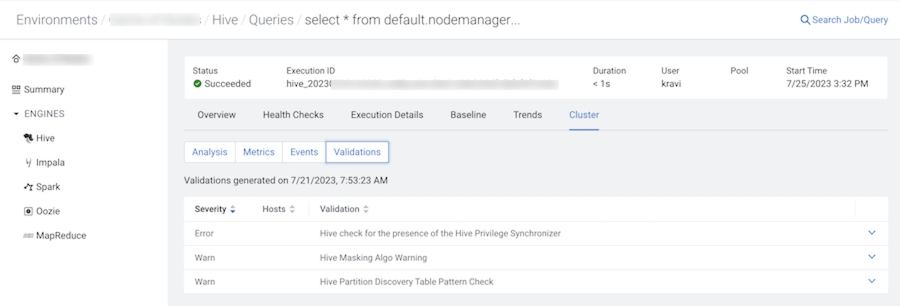
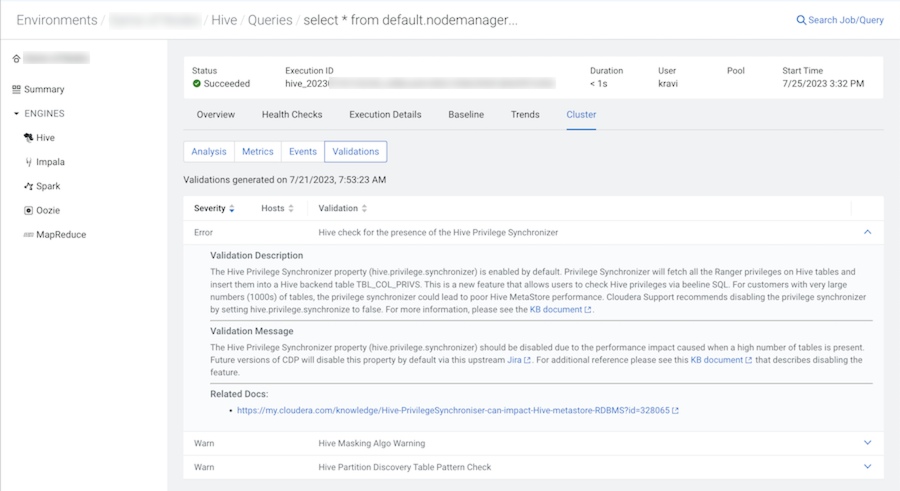
From the query's page, select the Cluster tab
and then select the Validations tab.
The Validations page opens, which displays the current alerts for the
Hive query that require attention.
Locate the alert of interest, expand and display the full details about
the alert, and then follow the recommended course of action to fix the
issue.
The following examples show the Cluster tab's
Validations page and several error and warning
Validation alerts. Where an Error severity indicates
incorrect settings and configurations that require attention and a
Warn severity indicates a potential problem that
eventually must be resolved but does not have to be completed at this time. The
Validation message for the Error alert explains why the
Hive Privilege Synchronizer property should be disabled and provides a link on
how to disable.