Determining the cause of slow and failed queries

You can identify the cause of slow query run times and queries that fail to complete using Cloudera Observability.

Describes how to determine the cause of slow and failed queries.

Steps with examples from a Virtual Cluster's Spark engine are used to explain how to further investigate and troubleshoot the cause of slow query run times.

  1. Verify that you are logged in to the Cloudera Observability web UI.
    1. In a supported browser, log into the Cloudera Data Platform (CDP).
      The CDP Cloud web interface landing page opens.
    2. From the Your Enterprise Data Cloud landing page, select the Observability tile.
      The Cloudera Observability landing page opens.
  2. From the Environment Name column in the Environments page, locate and click the name of the environment whose workload diagnostic information requires analysis and troubleshooting.
    For this example, select Virtual Cluster from the Environments list and then select a Virtual Cluster required for analysis.

    The Environment navigation panel opens, which hierarchically lists the environment and its services hosted on the selected environment.

  3. Verify that the Cluster Summary page is displayed.

    The Cluster Summary page, displays performance trends and metrics about the cluster's processed jobs and queries.

  4. Optional: From the time-range list, select a time period that meets your requirements.
  5. If not already expanded, from the Environment navigation panel expand the Virtual Cluster and then select the Spark engine.
    The engine's Summary page opens, in this case the Spark Summary page.
  6. From the Job Trend widget, click its Total Jobs value.
    The engine's Jobs page opens.
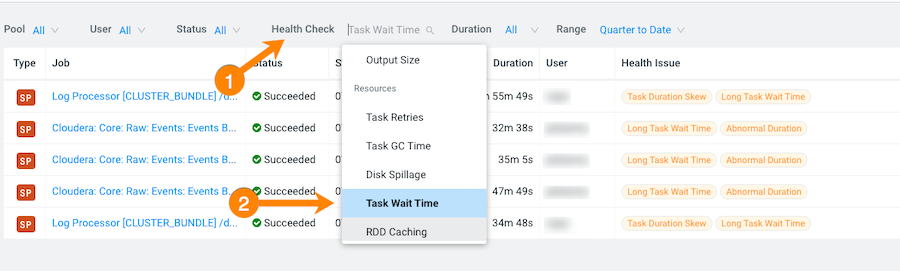
  7. From the Health Check filter's list, select Task Wait Time, which filters and displays a list of jobs with longer than average wait times before the process was executed.


  8. Display more details by selecting a job's name from the Job column and then clicking the Health Checks tab.
    The Baseline Health checks are displayed.
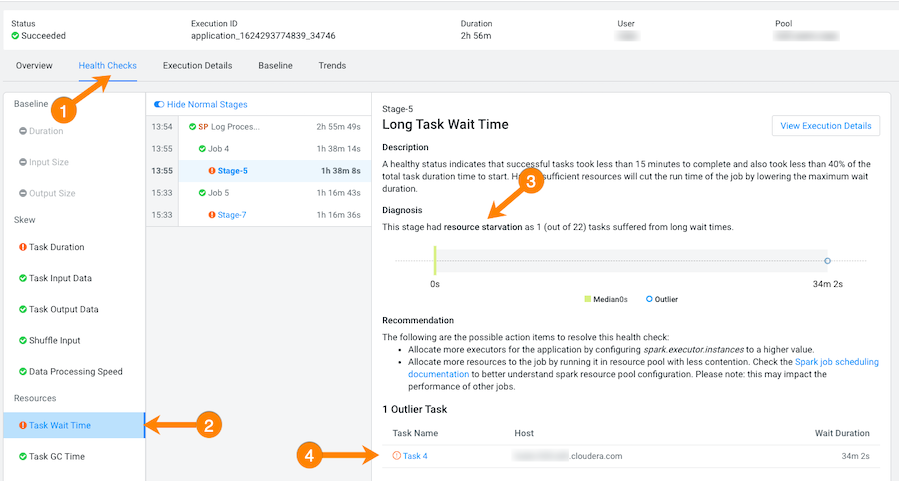
  9. From the Health Checks panel on the left, click the Task Wait Time health check, which opens a panel that describes the health check, displays information about the possible causes, and lists recommended solutions.
    In the following example, the long wait time occurred in Stage-5 of the job process due to insufficient resources. The Recommendation section lists items for you to complete that may resolve the problem and the specific outlier tasks that produced the unusual results:


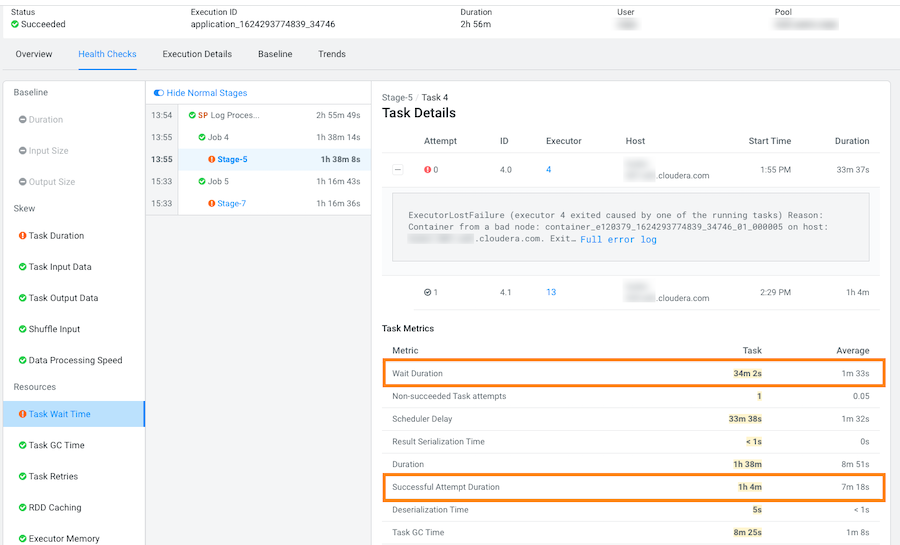
  10. To display more details about why this job is experiencing longer than average wait times, click one of the tasks listed under Outlier Tasks.
    In the following example, the Task Metrics section shows higher than average criteria measurement results and the Task Details reveal an ExecutorLostFailure error. This indicates a probable memory issue, where the container is exceeding the memory limits. In this case, more details may be found by clicking Full error log and reviewing the log: