Monitoring cluster profile using Kafka Connect in SMM
Learn how to monitor cluster profile with Kafka Connect in Streams Messaging Manager
(SMM).
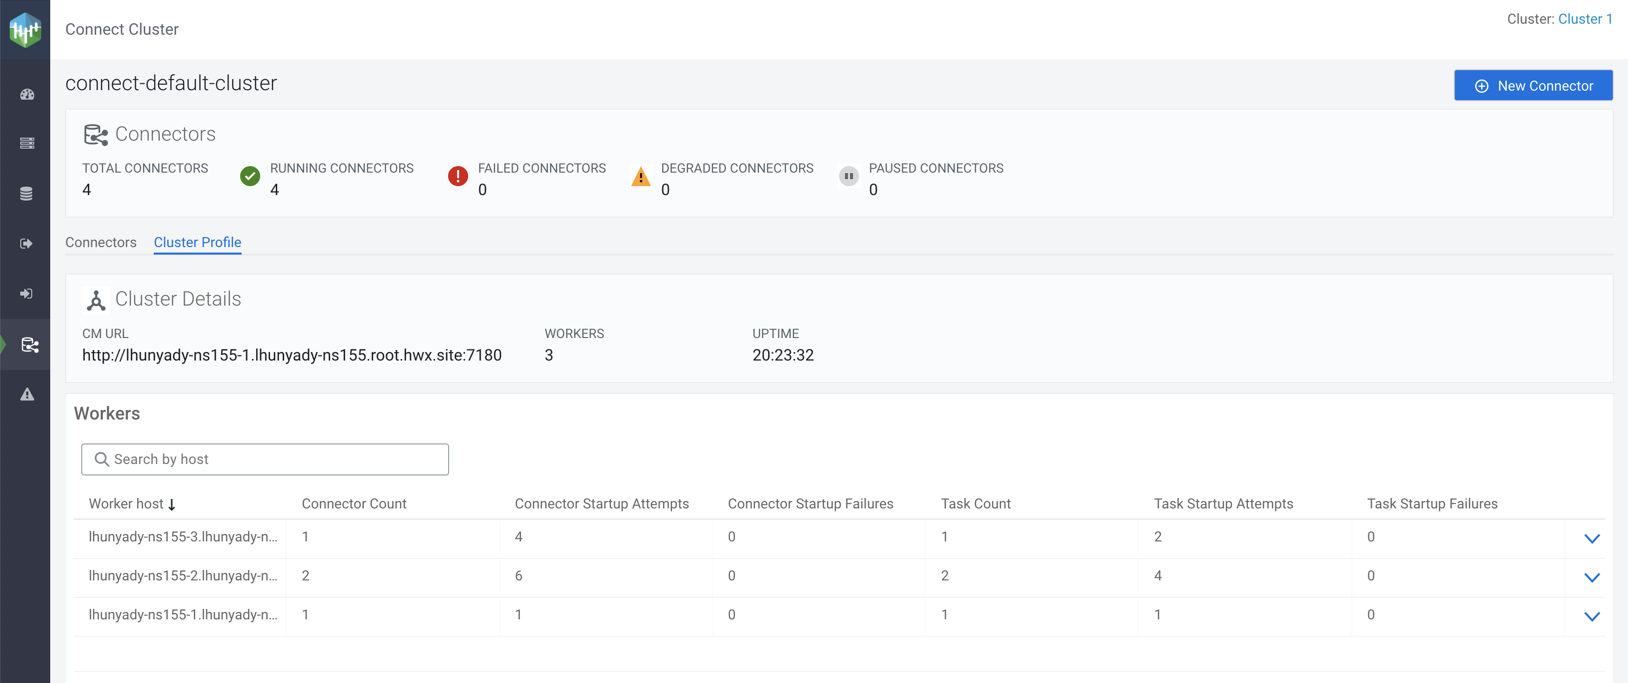
The Cluster Profile tab enables you to monitor details of the
cluster and workers. You can go to the Cluster Profile tab from the
Connect Cluster page, as shown in the following image:
In the Cluster Details section, you can monitor the
Cloudera Manager URL, number of workers, and uptime details.
In the
Workers section, you can monitor details of worker host, connector count,
connector startup attempts, connector startup failures, task count, task startup attempts, and
task startup failures.
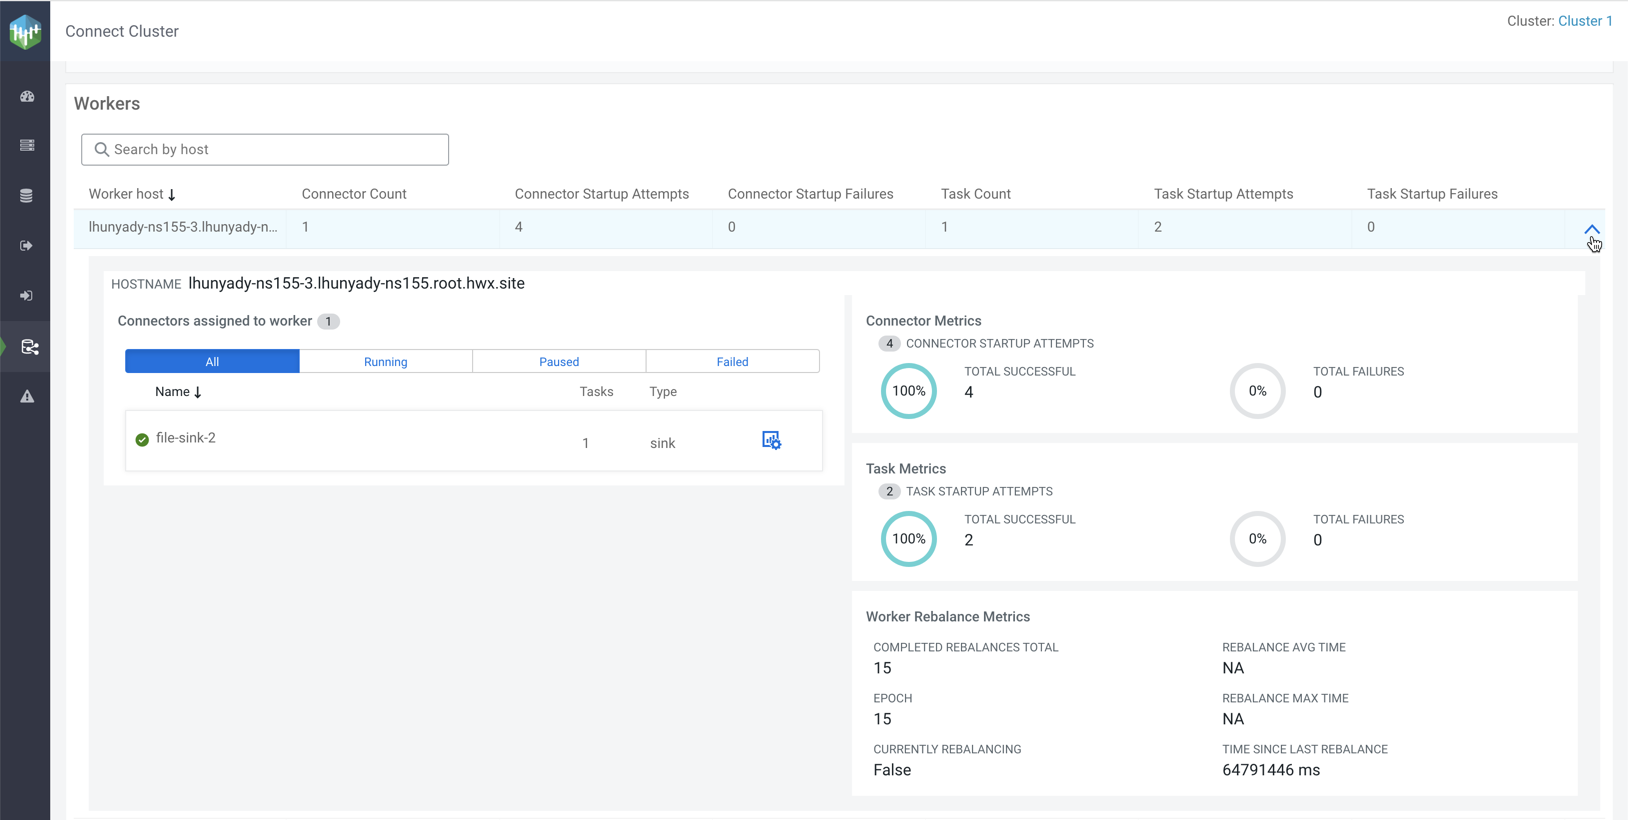
If you click the metrics arrow, you can monitor the
details and metrics of workers. The worker metrics showcases the connector metrics, task
metrics, and worker rebalance metrics, as shown in the following image:
The Workers section contains a Search by host
option that enables you to search for particular worker details by host.