Learn how to monitor connectors with Kafka Connect in Streams Messaging Manager
(SMM).
After you create a connector, you can monitor the details of the connector in the
Connector Profile and Connector Settings pages.
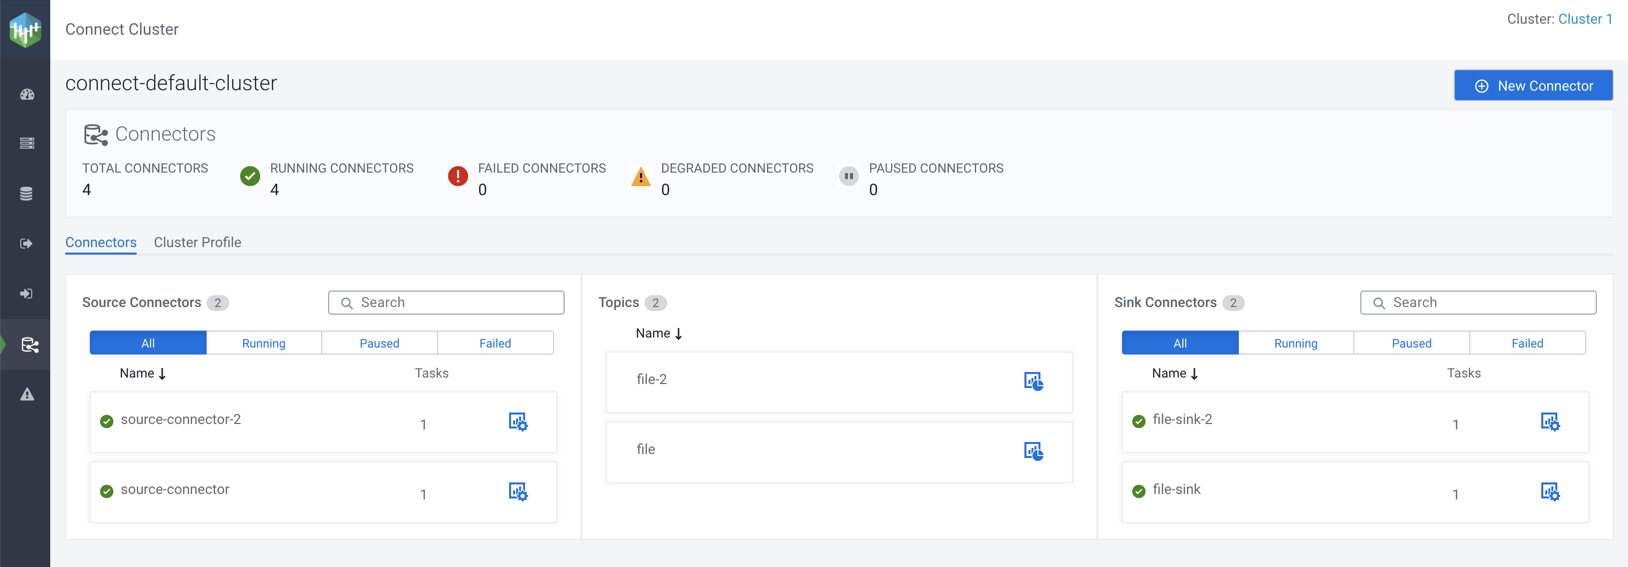
In the
SMM UI, when you click Connect from the menu, the first page that
appears is the Connect Cluster page with the Connectors tab
open, as shown in the following image:
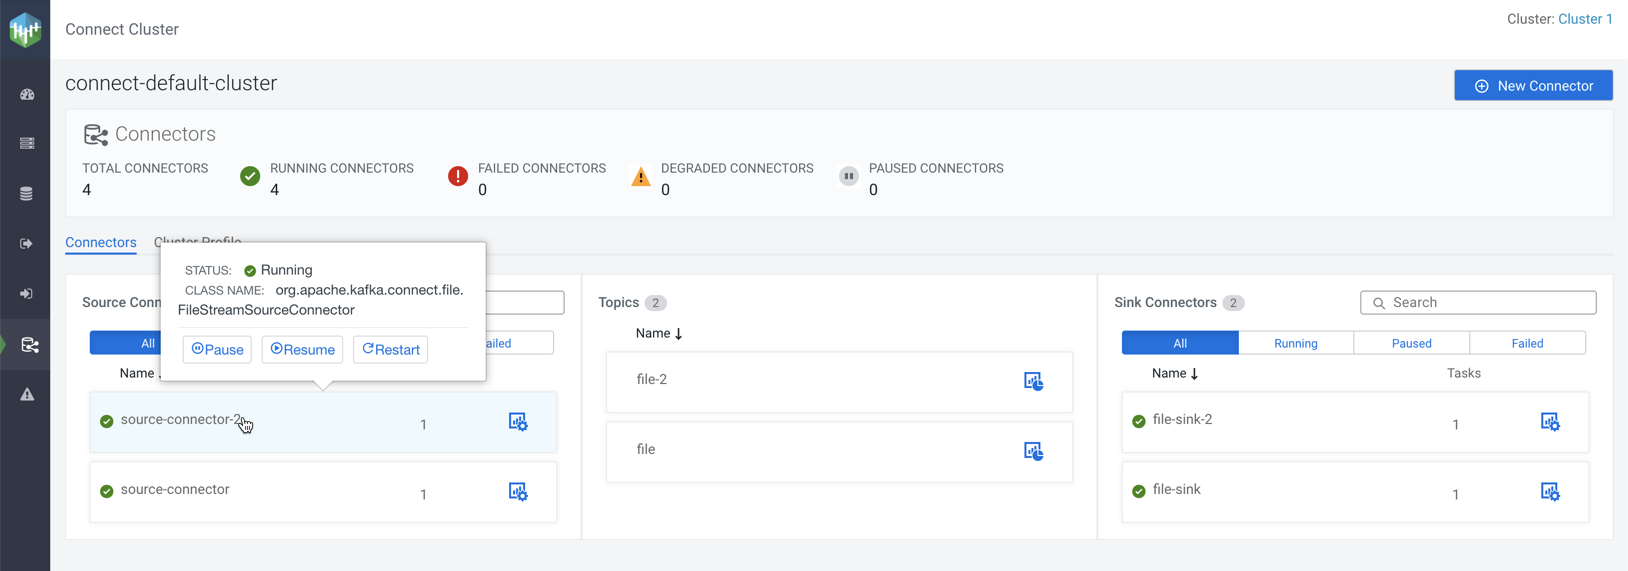
If you hover the mouse over a connector in the Connect
Cluster page, you can see the class name and status of the connector. You can also
see the options to pause, resume, and restart the connector, as shown in the following
image:
For more information on the Connect Cluster page, see Default view
of Kafka Connect in the SMM UI.
To monitor a specific connector, click the
Profile option () beside that
connector. The Connector Profile page appears.