Working with Data Discovery and Visualization
This section provides examples of the tasks you can perform using Data Discovery and Visualization.
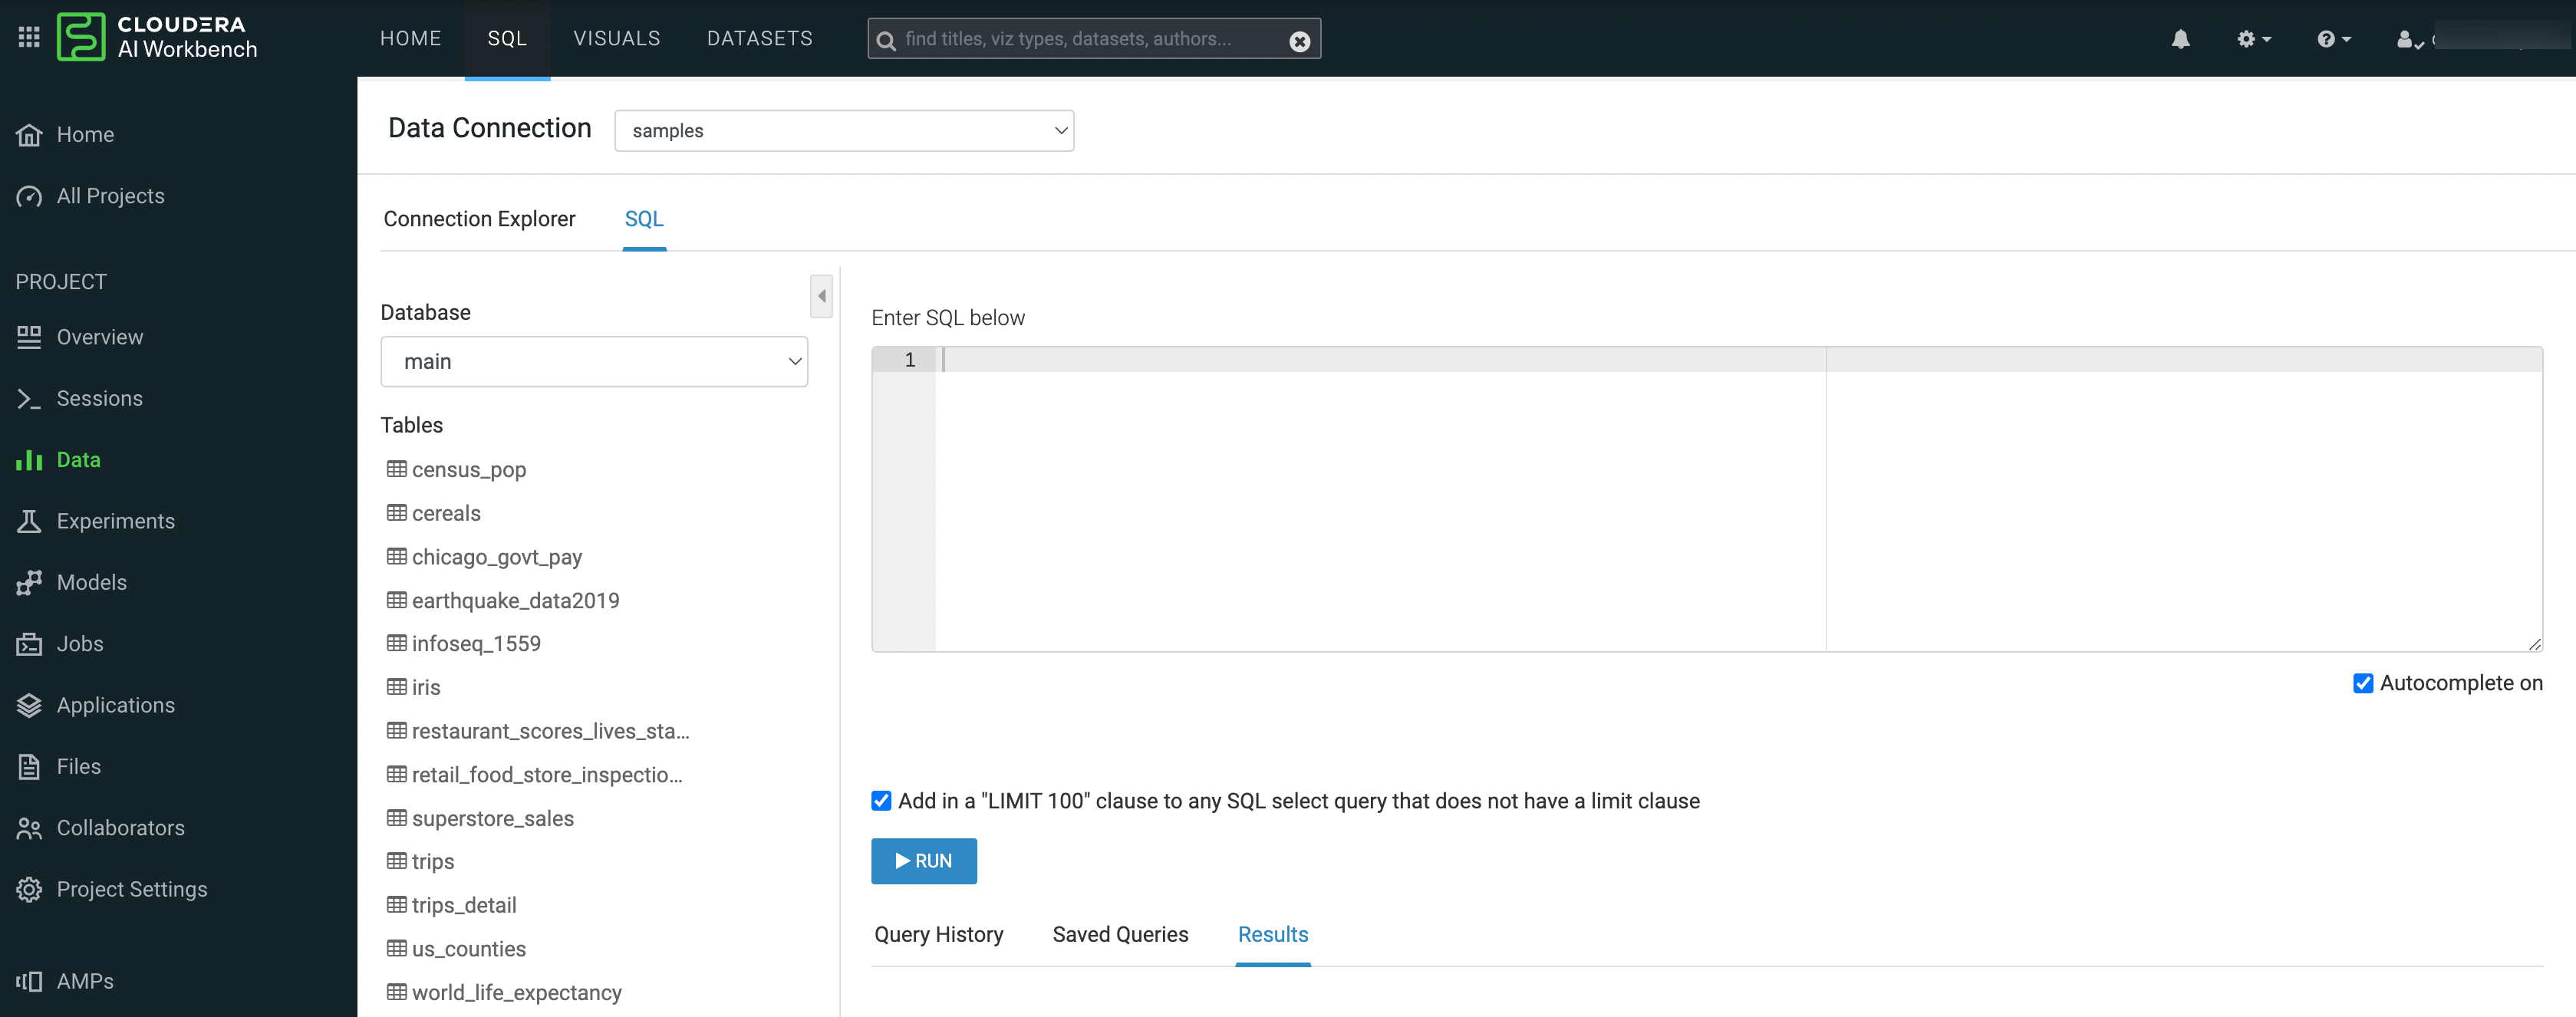
Run an SQL query
On the SQL tab, select a Data Connection from the dropdown box.
Once you select a Data Connection, you can explore the available databases and tables. You can start writing an SQL query and click the table names to insert them into the query string. For more information, see Creating a dataset.

Build a dashboard
Click New Dashboard to access the Dashboard Designer. You can select from a wide variety of graphs, click to add them to your dashboard, and select the columns from your dataset to use in the visual. For more information, see Create a Dashboard.

