Cruise Control dashboard in SMM UI
Learn about the Cruise Control section in the Streams Messaging Manager (SMM) UI, which you can use to monitor and manage the rebalancing process of Kafka clusters.
The Cruise Control UI in SMM allows you to monitor the state and operations of the Cruise
Control service, including the latest state of the Kafka cluster known to Cruise Control. The
Rebalance Wizard allows admins to start rebalance operations, specifying
goals, anomaly detectors and estimations that should be used for generating the rebalance
proposals. You can access the Cruise Control UI from the left navigation pane of Streams
Messaging Manager (SMM). Clicking on  loads the Cruise Control Dashboard.
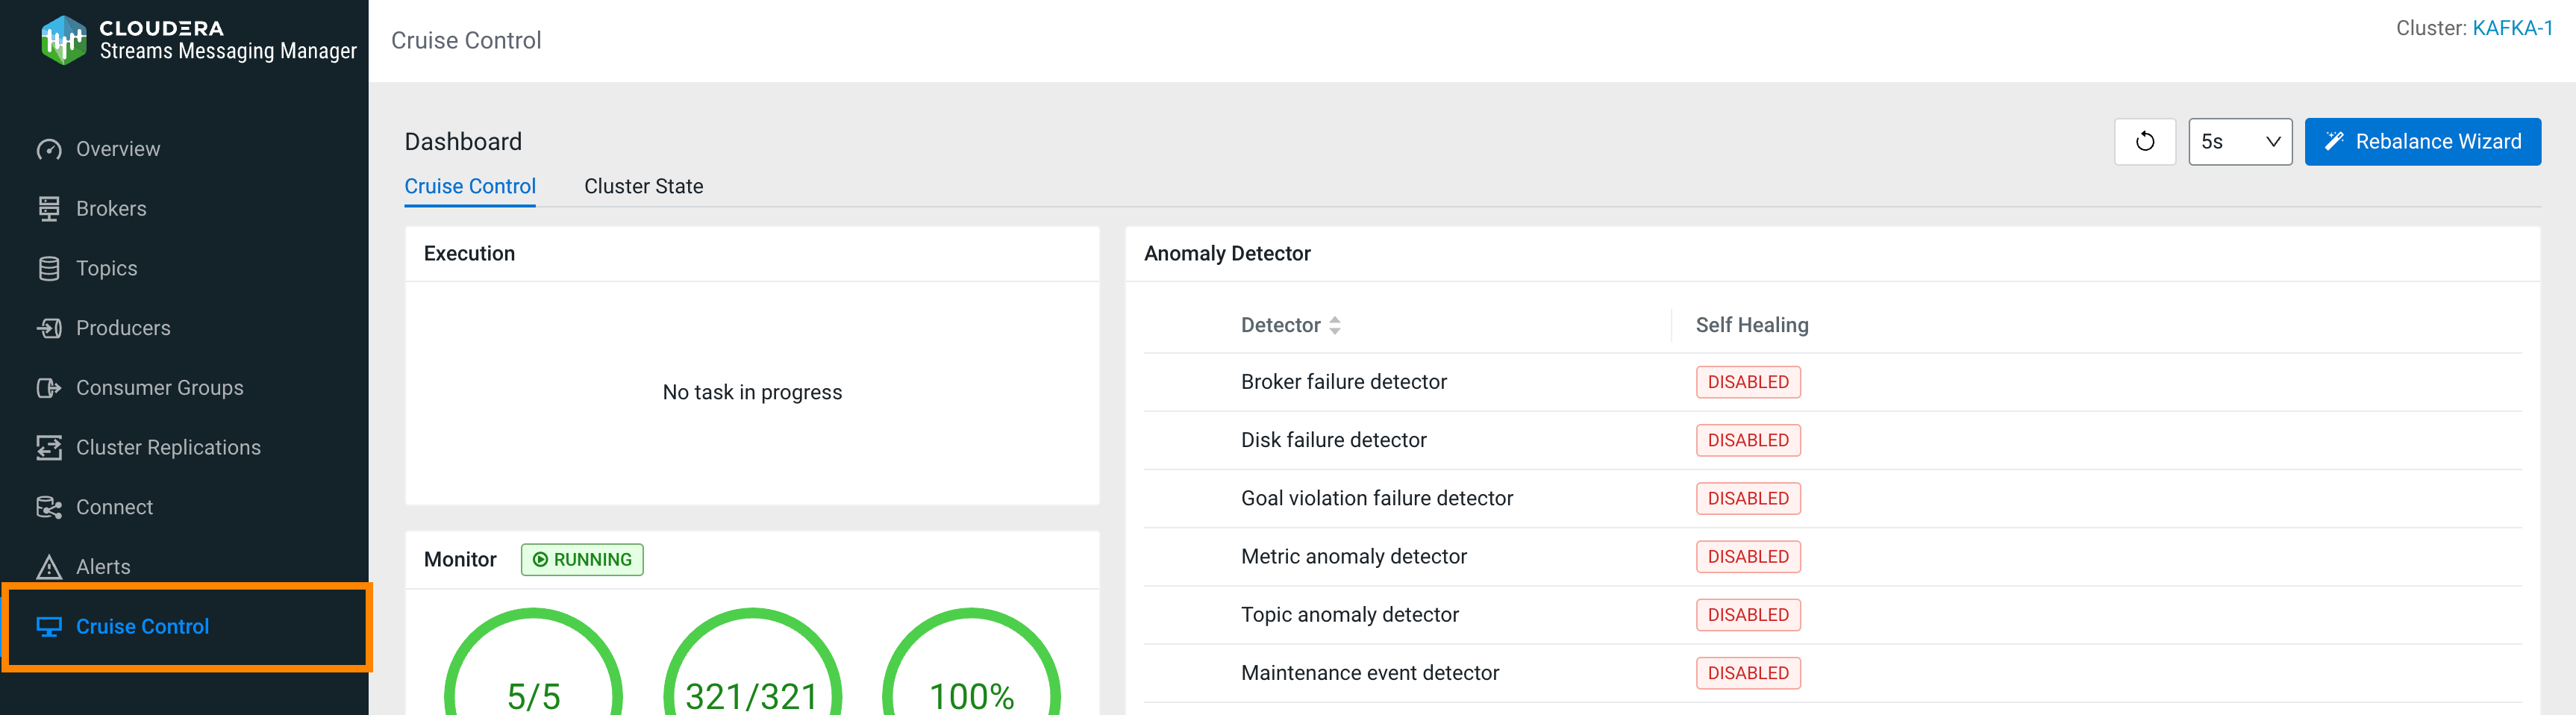
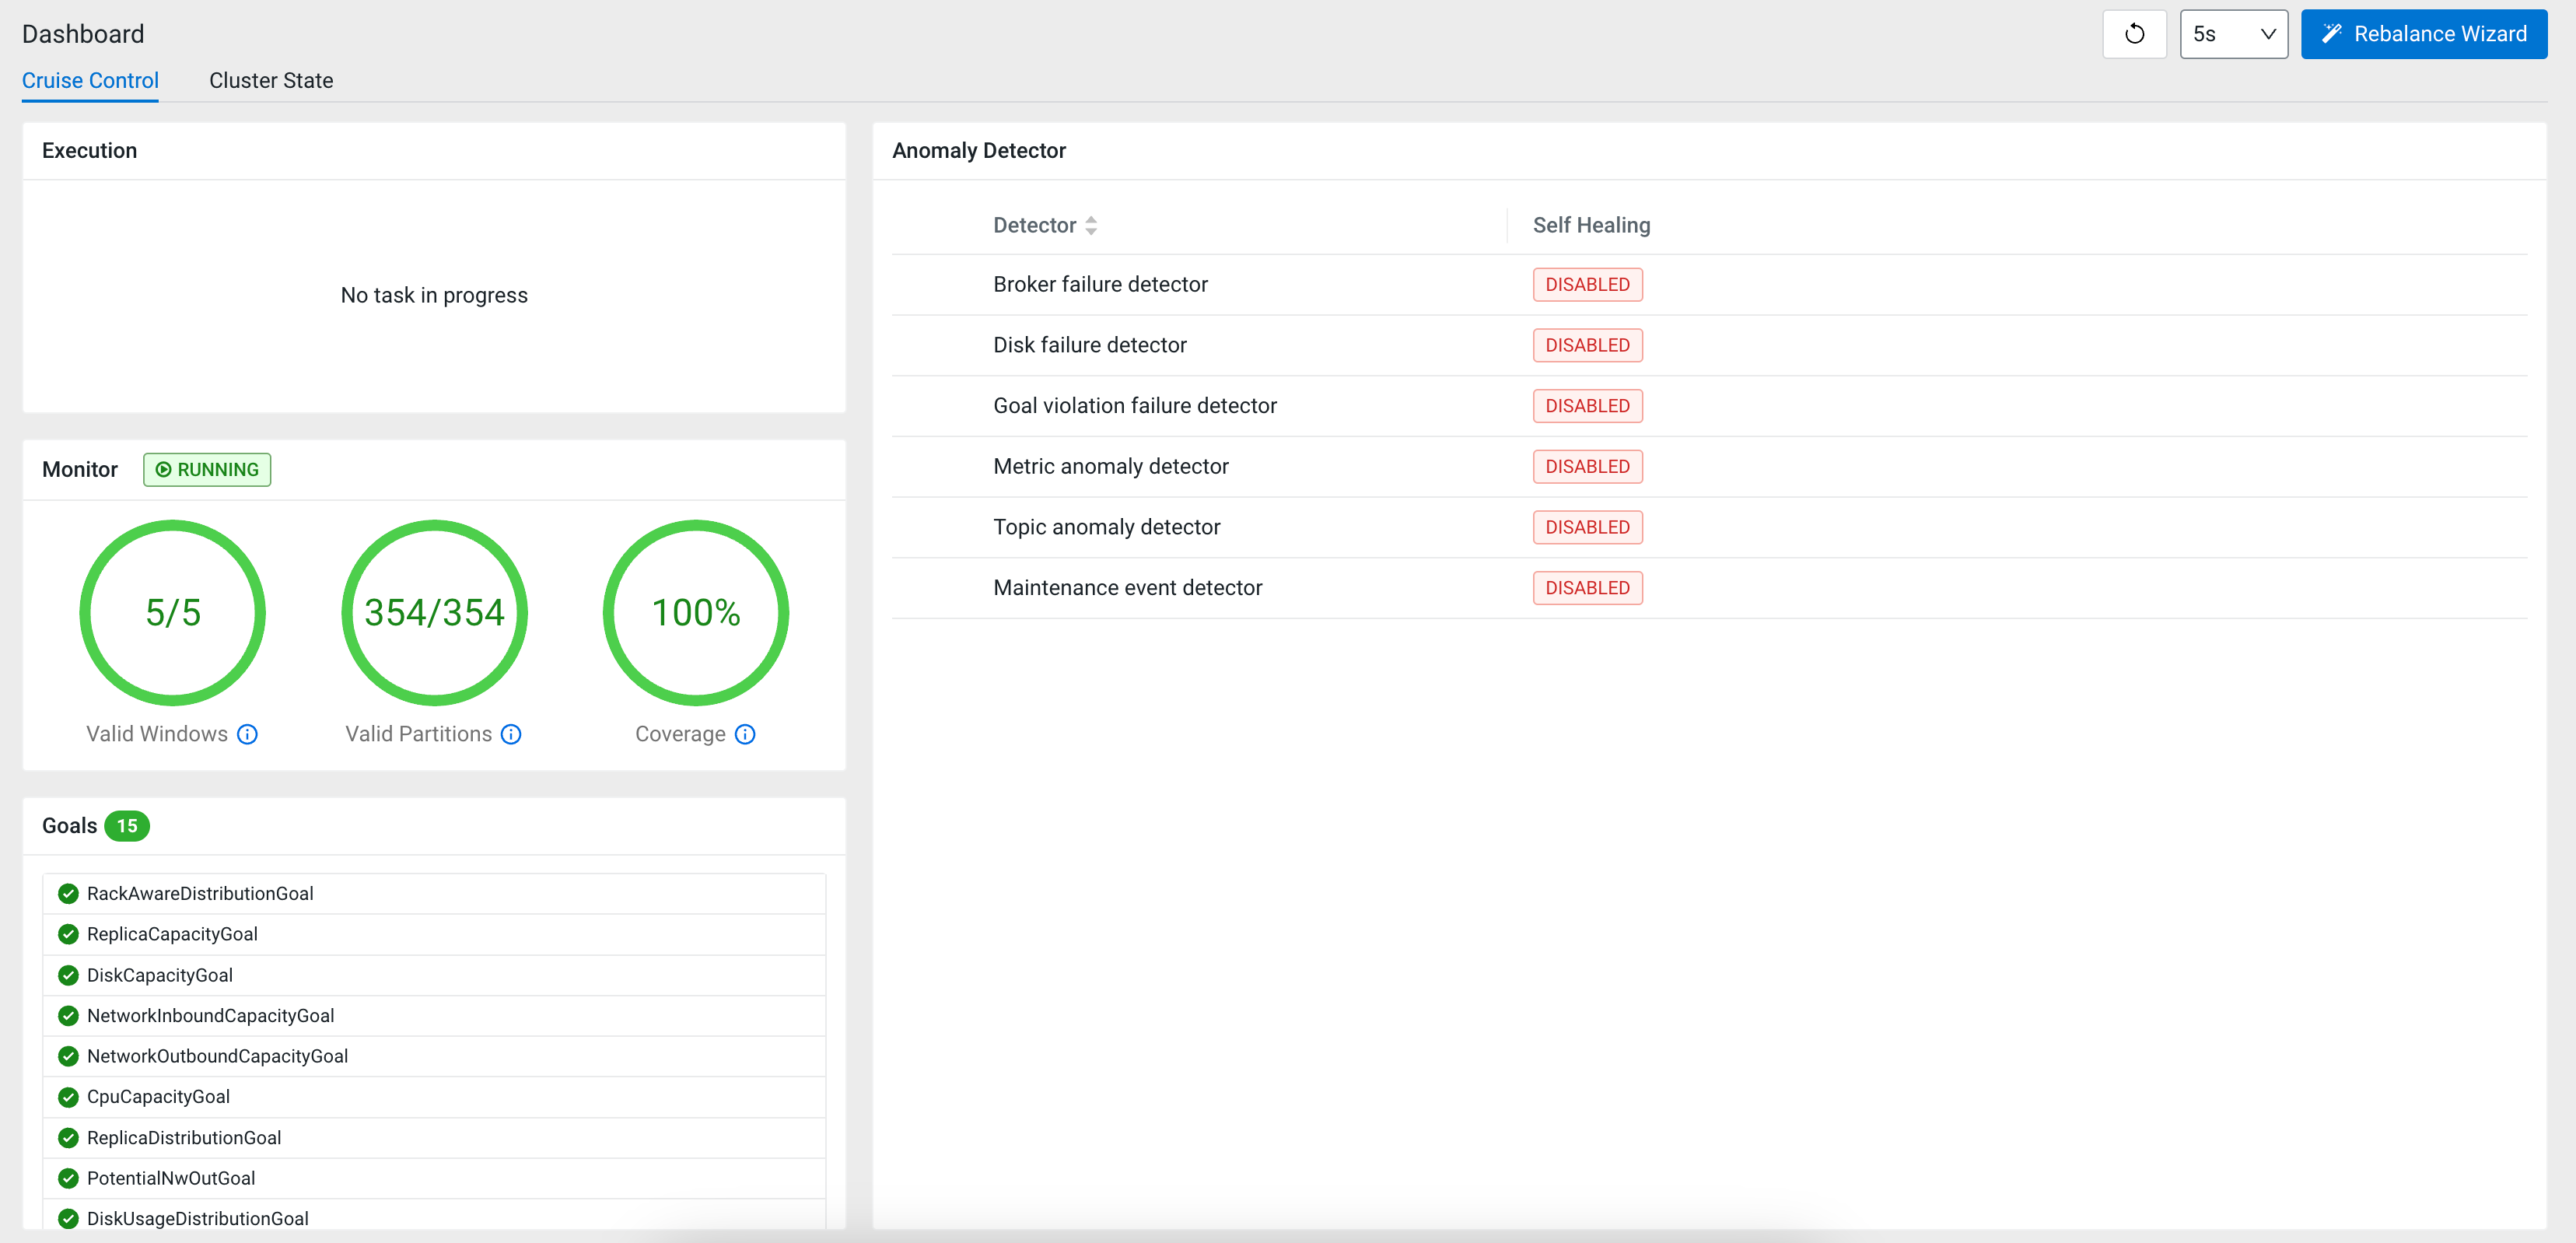
Cruise Control Dashboard
- Any operations that are currently being executed by Cruise Control and their progress
- Status of internal Cruise Control metrics (valid windows, valid partitions and coverage)
- List of goals configured in Cruise Control and their status (ready or not ready)
- List of anomaly detectors and their status (disabled or enabled)
You can manually refresh the Dashboard using  , or you can set a refresh
interval by selecting one of the options available with
, or you can set a refresh
interval by selecting one of the options available with  .
.
- Execution
- The Execution tile of the Dashboard allows you to
track and monitor the tasks being executed by Cruise Control (including rebalancing tasks that
are triggered by the enabled goals or other operations started through the REST API). If the
goals are fulfilled and there is no ongoing execution, the
No task in
       progress
message is shown. Only users with Admin level can stop the execution process.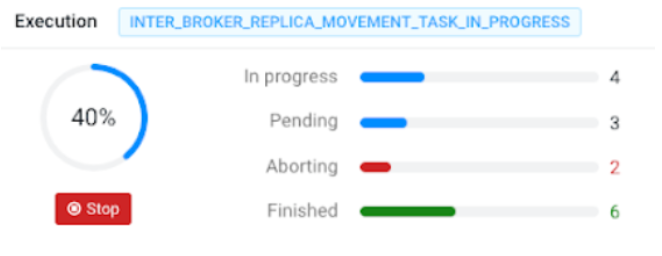
- Monitor
- The Monitor tile always shows the ratio of Valid
Windows, Valid Partitions, and Coverage
of the Kafka cluster.
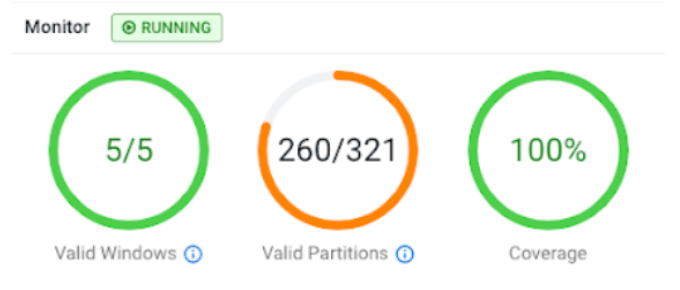
- Valid windows
- The metrics that Cruise Control collects about brokers and partitions in a Kafka cluster are aggregated in windows of time. A window represents a time range. There is a minimum number of metric samples that a window should have to be considered "valid" by Cruise Control. Only valid windows can be used for balance proposals and anomaly detection.
- Valid partitions
- Cruise Control aggregates metrics about each partition in the connected Kafka cluster.
There is a minimum number of metric samples a valid partition should have. The validity of
a partition is determined based on the valid metric samples count. The mechanism can be
configured in Cloudera Manager with the following Cruise Control configuration
properties:
Property Description num.partition.metrics.windowsThe maximum number of partition windows the Load Monitor keeps. Each window covers a time window defined by the partition.metrics.window.msconfiguration property.partition.metrics.window.msThe size of the window in milliseconds to aggregate the Kafka partition metrics. The window must be greater than the value of the metric.sampling.interval.msconfiguration property.metric.sampling.interval.msis the duration until metrics are collected and sampled. When an interval is ready, another interval starts and tries to collect the metrics from the brokers.min.samples.per.partition.metrics.windowThe minimum number of metric samples a valid partition window should have. If a partition does not have enough samples in a partition window, the topic of the partition is removed from the window due to insufficient data. max.allowed.extrapolations.per.partitionThe maximum number of extrapolations allowed for each partition. A partition is considered as invalid if the total number extrapolations in all the windows goes above this number. Load Monitor contains information about the status of the linear regression model, which is used to estimate the CPU utilization, number of valid windows and partitions. If there are flawed partitions, not all windows have metrics. Cruise Control extrapolates these metric values. - Coverage
- The coverage of this cluster model through monitored partitions ratio, showing how representative the cluster is.
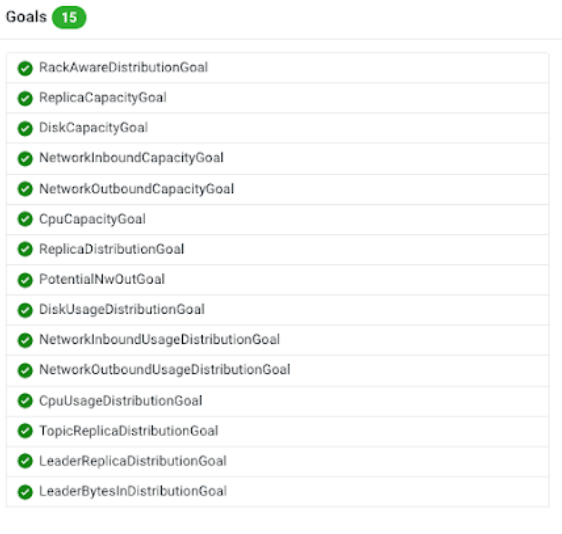
- List of Goals
- The Goals tile shows the list of enabled goals and indicates if the
goals have been fulfilled or not with checkmarks. The list of goals can be configured in
Cloudera Manager. For more information, see Setting capacity estimates and
goals.
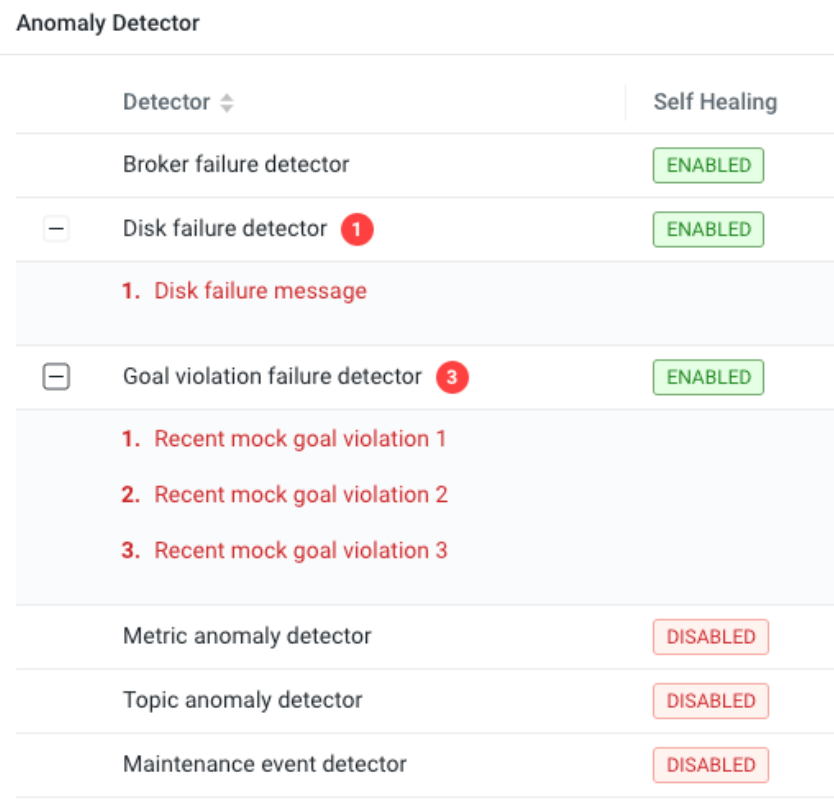
- List of Anomaly Detectors
- The Anomaly Detector tile shows the list of anomaly detectors and
whether self-healing is enabled for the given detector. If there are any anomalies found by
the detectors, the anomalies are listed under the corresponding detector.
Cluster State Dashboard
The Cluster State Dashboard provides an overview of the Kafka cluster specific metrics related to leaders, replicas, and directories. The metrics shown on the Dashboard are based on the number of leaders, online, offline and out-of-sync replicas, online and offline directories within the brokers available on the Kafka cluster. You can use these metrics to monitor the Kafka cluster state.
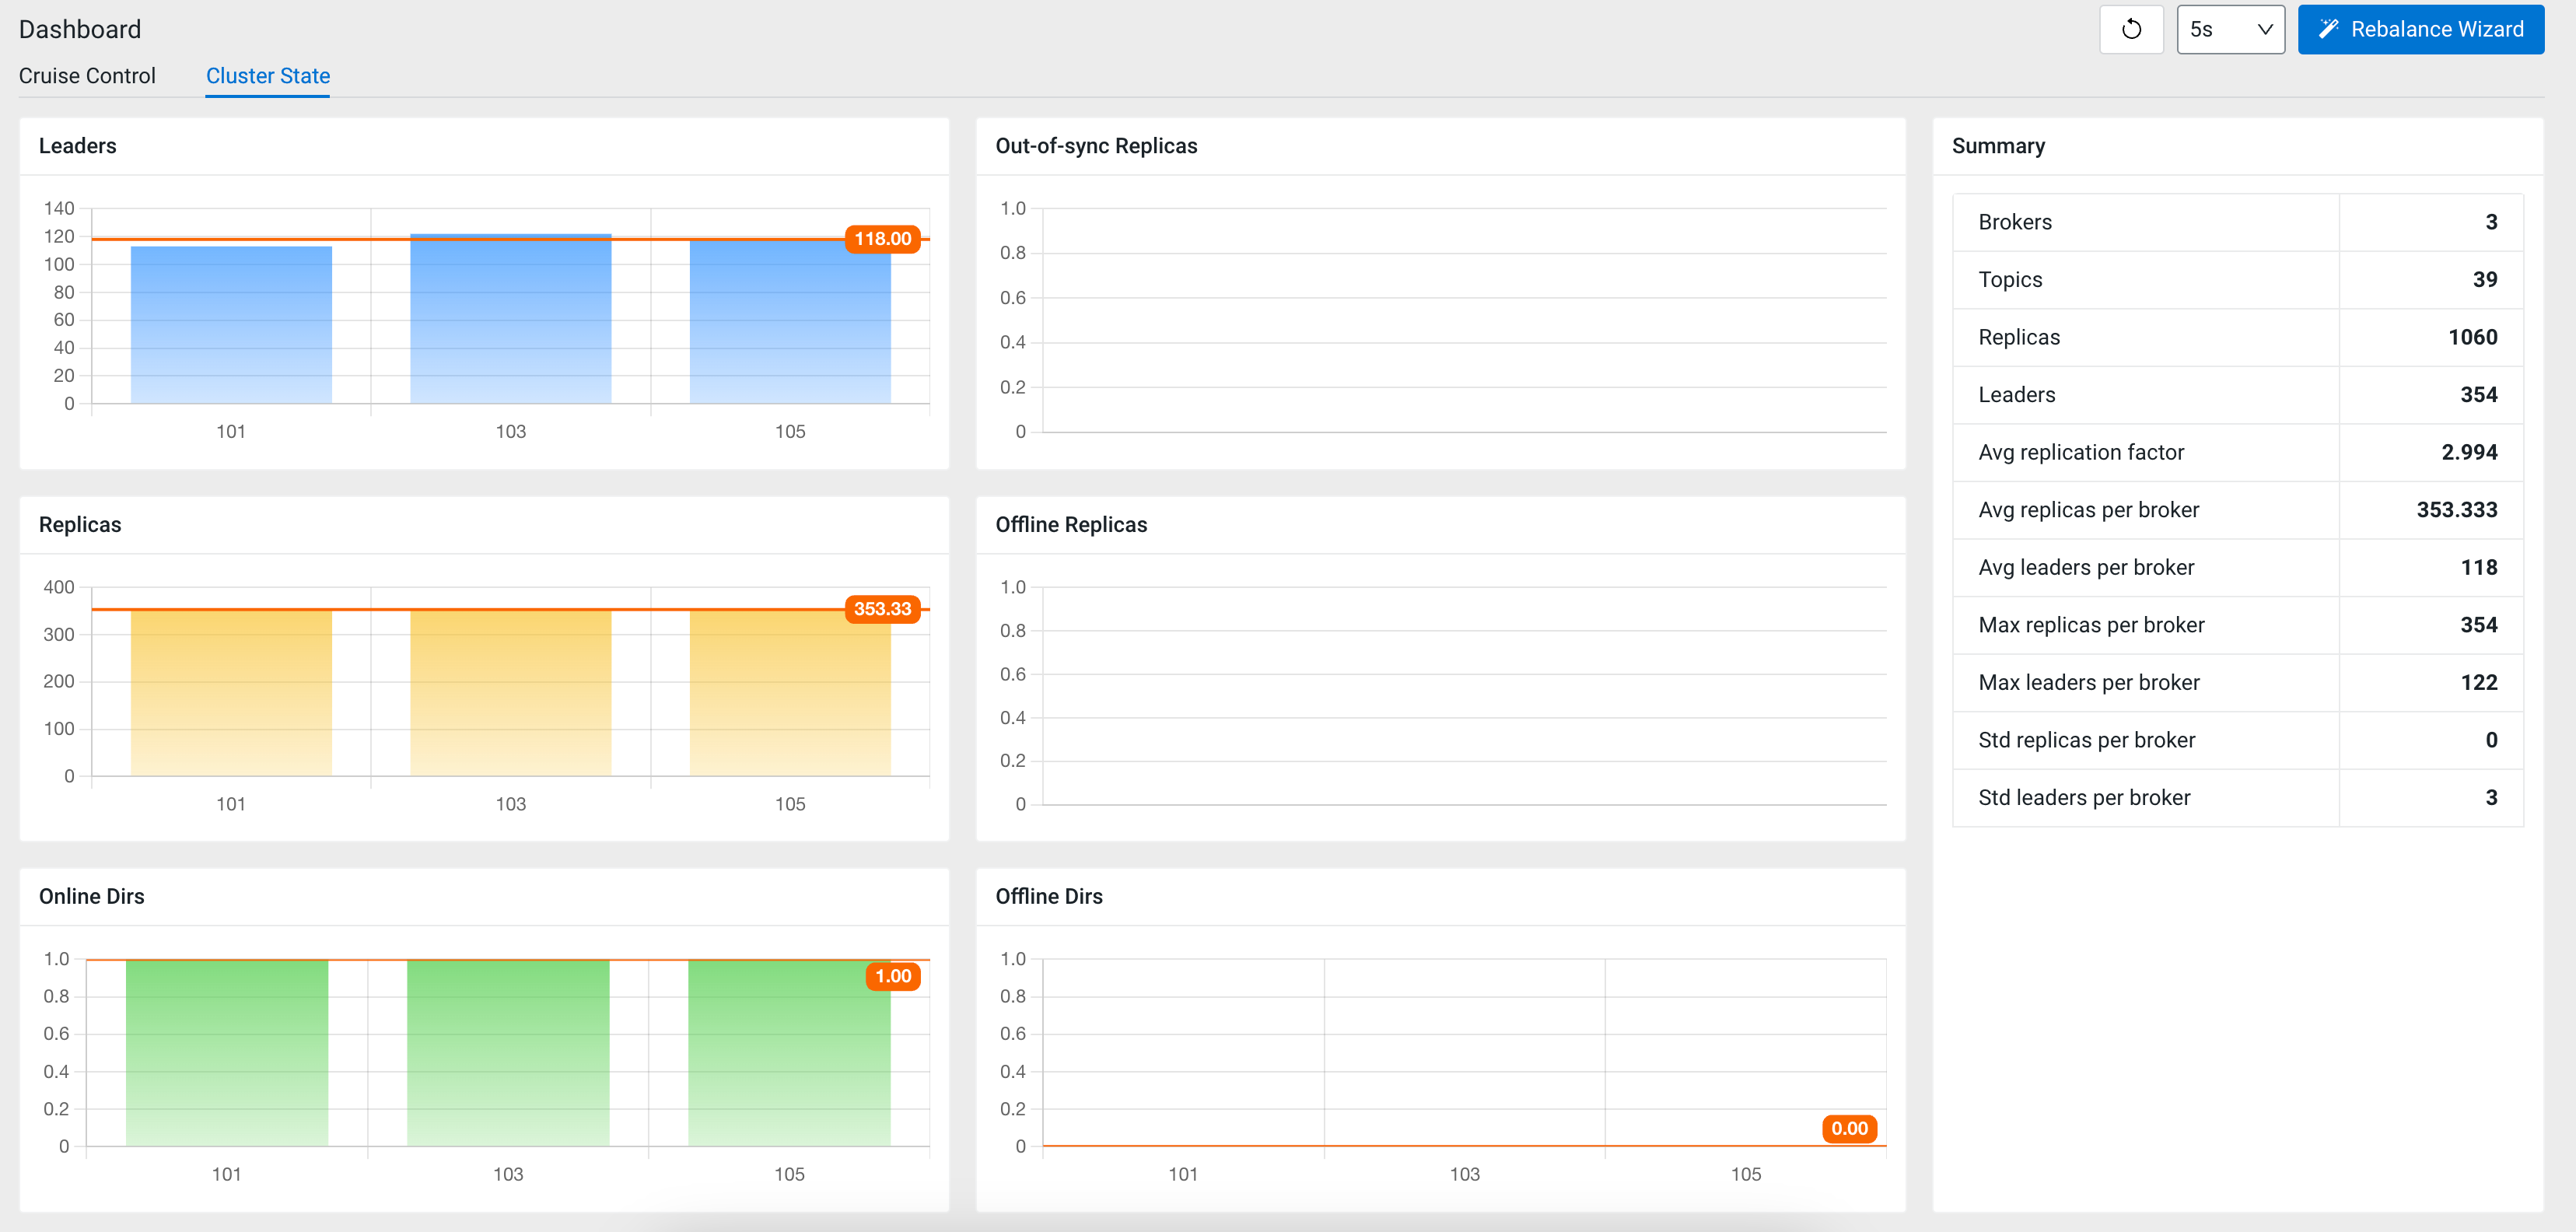
In the Summary section, you can review the general information of the number of brokers, topics, replicas and leaders within the Kafka cluster, and more metrics that show the average, maximum and standard ratio of leaders per broker and replicas per broker.