Identifying Rogue Users from a Workload View
This task identifies rogue users, which are users that consume excessive amounts of resources that can impact your costs.
Describes how to use Workload Manager or Workload XM to identify rogue users.
-
Record any problems.
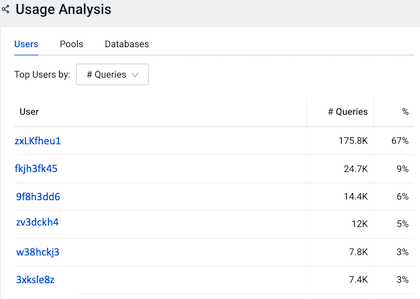
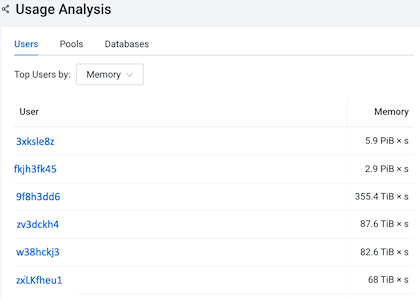
For example, when comparing memory consumption with the number of queries assigned to all users in the following Usage Analysis chart widget you will notice that the 3xksle8z user is running only 3% of the queries assigned, yet their queries are consuming more memory (5.9 PiB) than any other user.
To discover which queries executed by user 3xksle8z are consuming the largest amount of memory, a new workload view was created to track this user’s resource consumption.
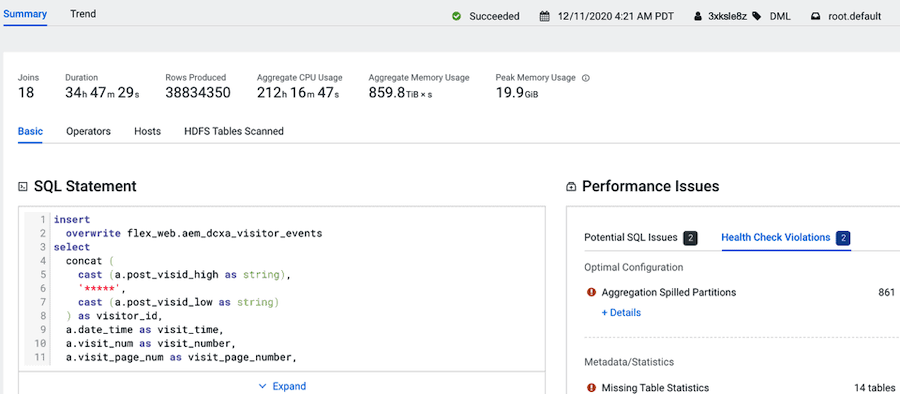
The following image shows the metrics of a SQL Statement that was identified as using an excessive amount of CPU from the new workload view, where there was over 200hrs CPU usage during a 34 hour period. Further metrics are displayed that show performance issues, identified as aggregation issues, and that show there are 14 tables missing table statistics.