Identifying Workload Problems and Health Issues
This task identifies what workloads are running on your CDH and HDP clusters and if there are any health issues that exist or were encountered and not addressed.
- The cluster's Usage Analysis chart widget enables you to visually see what engines are running on the cluster, how many jobs or queries are processed by the engine, and how many jobs or queries have failed and missed their SLA.
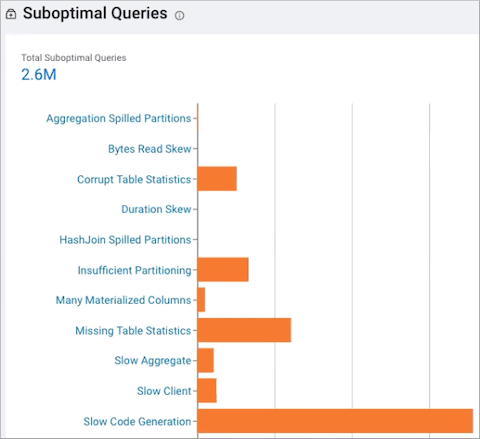
- The Suboptimal chart widget enables you to visually
see at a glance what issues are currently impacting your jobs or queries and
how they are executing on your cluster.
This chart uses the Workload Manager and Workload XM health tests and shows the distribution of jobs and queries that failed. The health tests are performed when a job or query has finished and provide insight into the performance of the job or query, such as how much data was processed and how long it took to process.
The Health Check list, on the engine’s Jobs or Queries page, categorizes the health tests. For example, for an Impala engine, the Aggregation Spilled Partitions, HashJoin Spilled Partitions, and Slow Client health checks, test for resource health issues. For Hive, MapReduce, Oozie, and Spark engines, the Insufficient Partitioning and Many Materialized Columns health checks, test for query and schema issues, such as, is the code using SELECT * on millions of columns.
These categories further enable you to understand the type of problem:- Metadata/Statistics
- Optimal Configuration
- Performance
- Query/Schema Design
- Skew
- Baseline
For more information about each health check, see Related Information.
-
Scroll down to the engine's Suboptimal widget chart, as
shown in the following example image. Record the health tests that contain a
bar, which denote health tests that were violated.