Learn how to use KPIs to monitor connection usage.
You want to track errors in a failure queue. You read
data from a Kafka topic and apply a schema to it. The schema does not fit the message
and the operation fails. You do not want to process the message and route it to a
failure queue. Now, you want to track data quality in your deployment. You can achieve your goal by selecting appropriate KPI
scope and metric while deploying your flow in Cloudera Data Flow. You
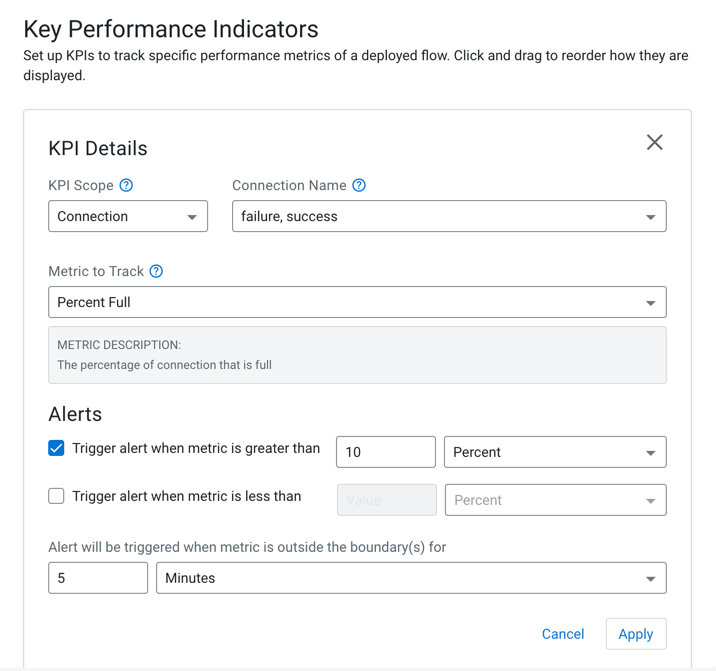
need to create a KPI on this queue to track failure. Select
Connection KPI scope, connection name, and Percent
Full metric to track. The Percent Full metric indicates how much of the
queue’s capacity is used for your data flow. You must have reached the Add New KPI screen while deploying
your flow in Cloudera Data Flow.
Select Connection as the KPI scope.
Select Percent Full as the metric to track.
Select the failure queue, you created, in the Connection
Name field.
Configure the alert settings as per your requirement or when you want to be
alerted.
Click Apply.
Similarly, you can set other metrics and alerts as per your
requirement.
In this example, you get an alert when 10 percent of the queue’s capacity is used for storing
failure messages for 5 minutes.