Monitor deployments
You can monitor the health of deployments in the Deployments page of the Cloudera Data Flow UI. You can track the status of the deployment, and data throughput (sent / received) within a 30 minute window.
You can perform the following tasks in the Deployments tab of the Deployments page:
- Monitor health of deployments
- Filter and sort deployments
- Fetch metrics details for deployments
- Refresh deployment data
The Deployments view
Monitor the status and the data throughput (received / sent) within a 30 minute window for your deployments. You can also view the details of the amount of data sent and received in a graphical format.
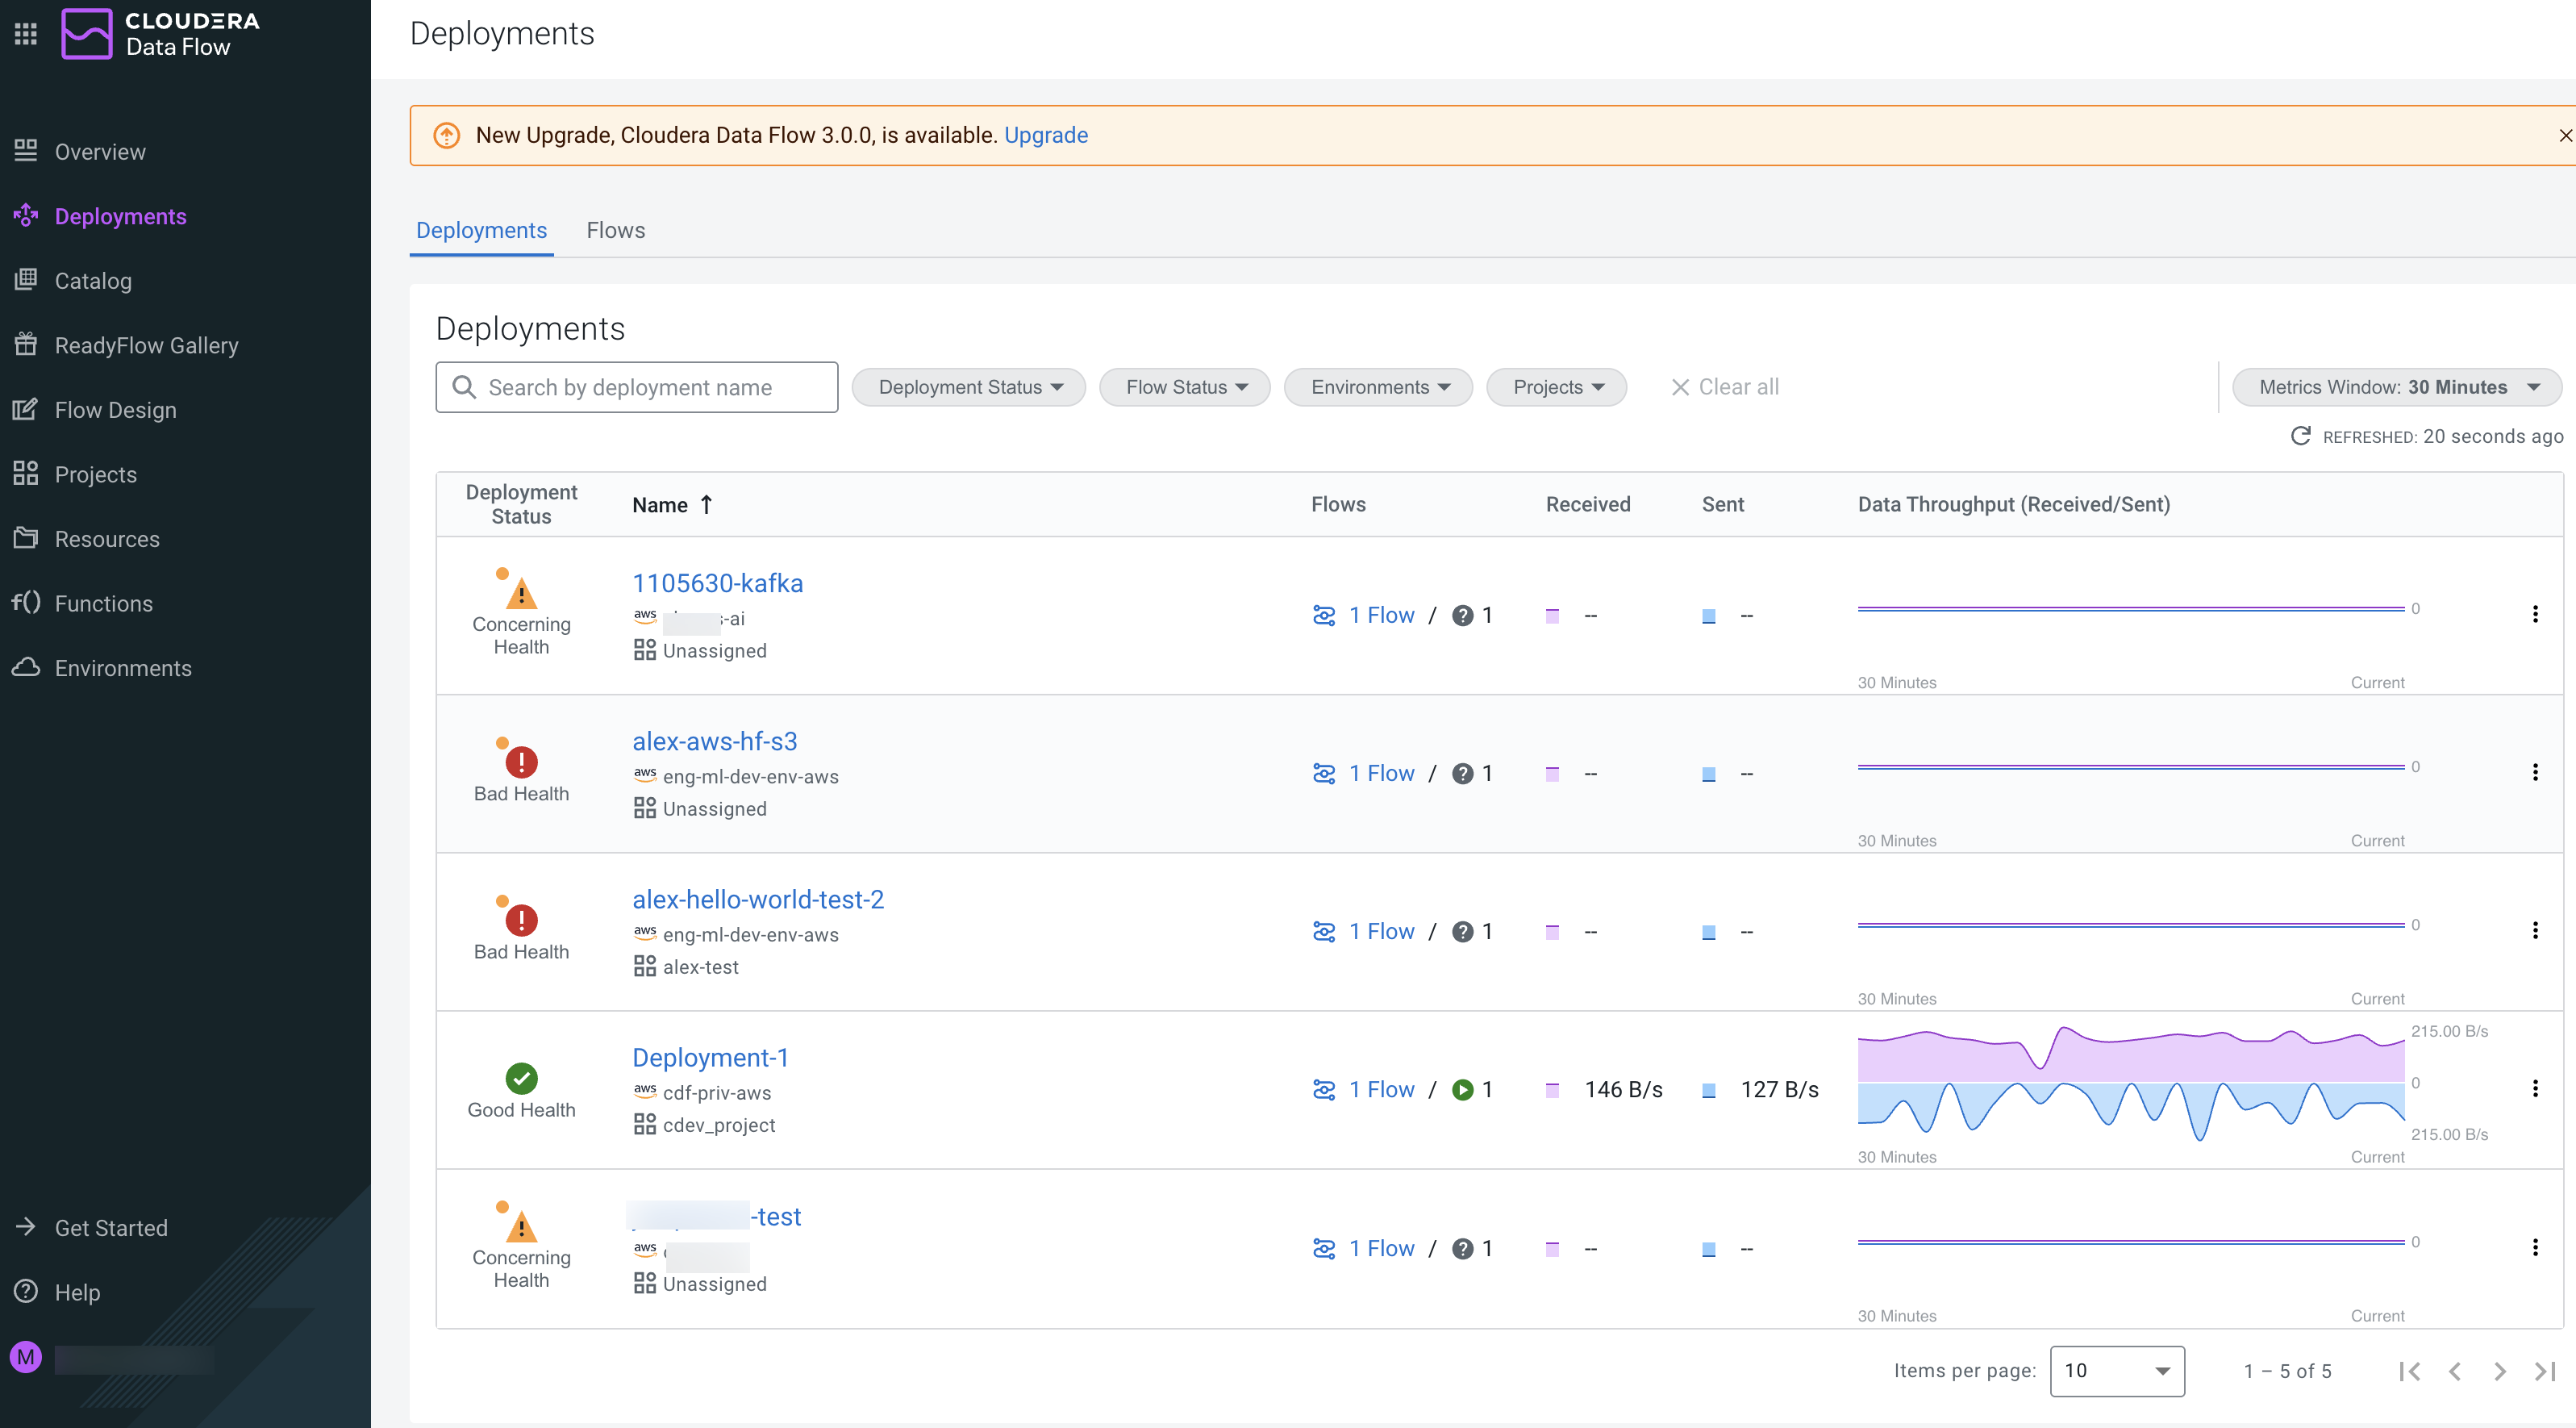
You can monitor the following details of your deployments in the Deployments page:
- Deployment status
-
Shows status of your deployments including Good Health, Terminating, Updating, Unknown, Deploying, Suspended, Concerning Health, and Bad Health. You can also click Status to sort deployments by status as required.
- Deployment name
-
Shows the name of your deployments. You can also click Name to sort your deployments by name if required.
- Deployed flows
-
Shows the number and status of flows on a given deployment.
- Data received
-
Shows the amount of data that your deployments currently receive from the source. You can click Received to sort your deployments by the amount of data they receive.
- Data sent
-
Shows the amount of data that your deployments currently send to the targets. You can click Sent to sort your deployments by the amount of data they send.
- Data throughput (Received/Sent)
-
Shows graphical representation of data received and sent by your deployments in the selected metric window.
Filter and sort deployments
Filter the deployments according to your requirement.
You can filter your deployments by:
- Deployment name
-
You can use the search box to look for deployments by name.
- Deployment status
-
Deployments can be in many different statuses, including Bad Health, Concerning Health, Good Health, Deploying, Starting, Suspending, Suspended, Terminating, Unknown, and Updating. By default, all statuses are selected.
- Flow status
-
Select deployments by the status of flows deployed on them, including Bad Health, Changing Flow Version, Concerning Health, Deploying, Deployment Suspended, Flow Stopped, Good Health, Importing Flow. By default, all statuses are selected.
- Environment
-
You can either select all environments or a specific environment which is enabled. By default, all environments are selected.
- Project
-
You can filter your deployments by project affiliation.
Click Clear all to set the filter options to their default values.
You can sort deployments by:
-
Status
-
Name
-
Data currently received
-
Data currently sent
Set metrics window
The Metrics Window option enables you to fetch details for your flows for a specified time. For example, if you select 30 minutes in the Metrics Window, the Cloudera Data Flow UI displays details of your deployments for the last 30 minutes, and if you select 1 hour, the UI displays details of your deployments for the last one hour. You can also select 12 or 24 hours based on your requirement.
Refresh deployments data
By default, every 30 seconds all data for your deployments are updated. Click the
![]() [Refresh] icon to refresh the data.
[Refresh] icon to refresh the data.