Use KPIs to track the processing latency of streaming data

Learn how to use KPI to track the processing latency of streaming data.

Your flow starts reading data from an external system and ends writing the data to some other place. In between all processing is done. A common question or a common performance indicator that you want to track might be how long does it take for the data to be processed.
You can achieve your goal by selecting appropriate KPI scope and metric while deploying your flow in Cloudera DataFlow. Select Processor KPI scope and Average Lineage Duration metric to track. The Average Lineage Duration metric tracks the time elapsed between when the original source data was received and the time when the processing event occurred.
You must have reached the Add New KPI screen while deploying your flow in Cloudera DataFlow.
  1. Select Processor as the KPI scope.
  2. Select the processor, you want to monitor, in the Processor Name field.
  3. Select Average Lineage Duration as the metric to track.
  4. Configure the alert settings as per your requirement or when you want to be alerted.
  5. Click Apply.
    Similarly, you can set other metrics and alerts as per your requirement.

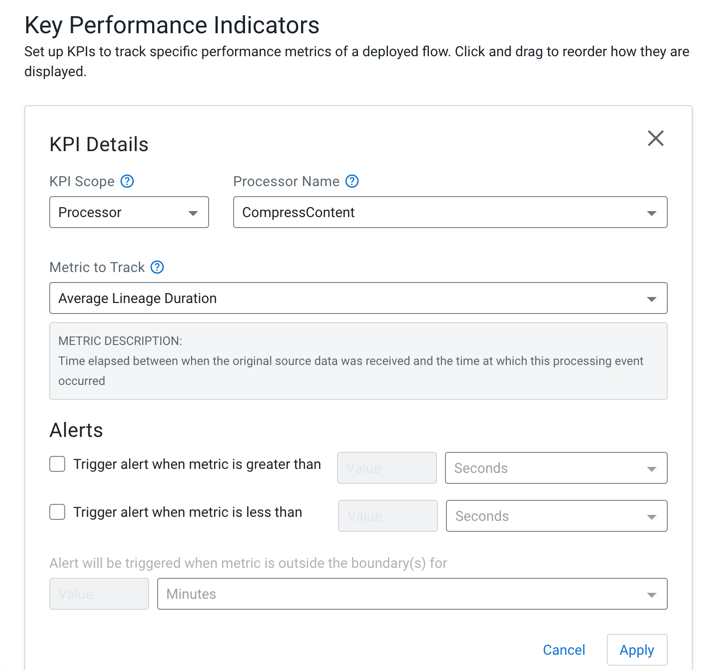
In this example, Processor KPI scope and Average Lineage Duration metric to track are selected. No alert is set here.